
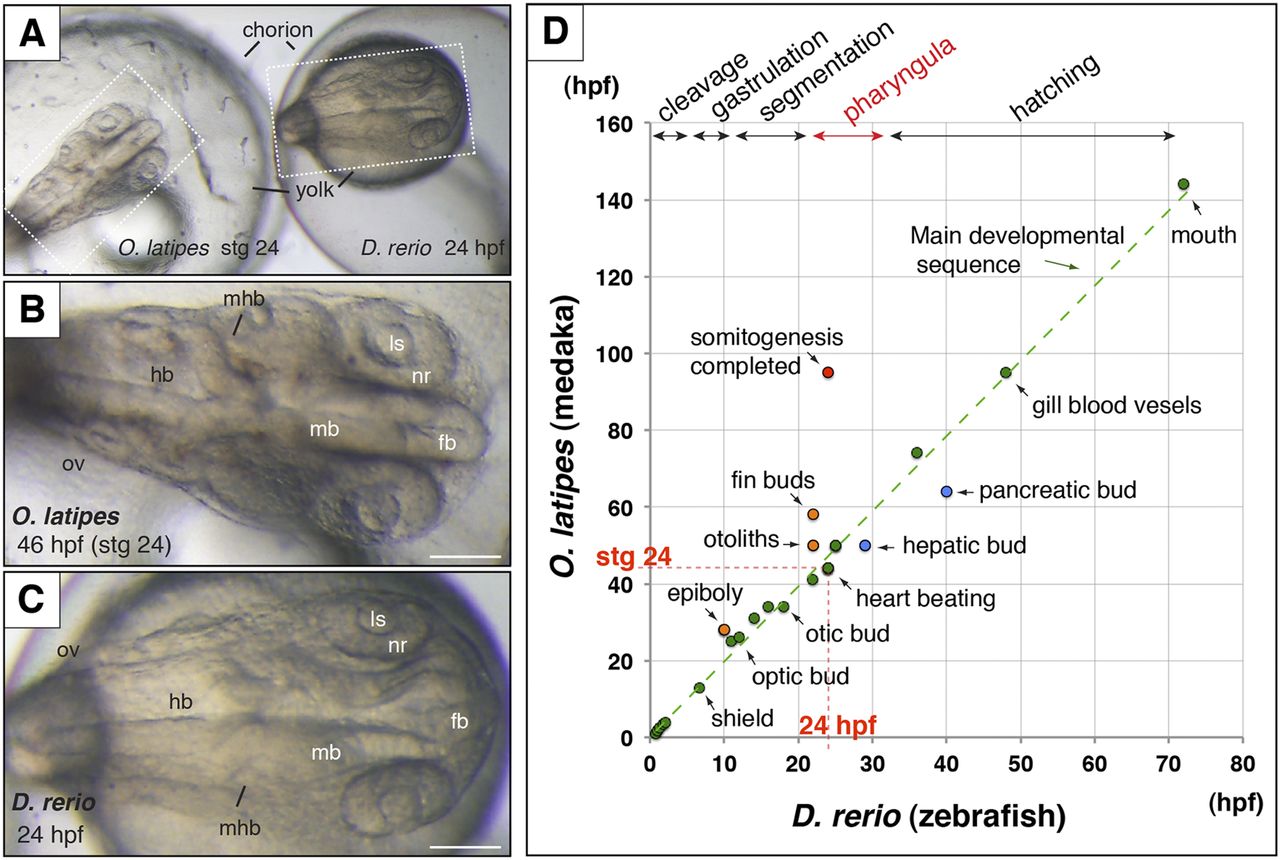
Comparative anatomy of stage 24 (44 hpf) medaka (O. latipes) and 24-hpf zebrafish (D. rerio) embryos during the phylotypic window (A). Note that both embryo size and general body plan are comparable between medaka (B) and zebrafish (C) at selected stages. The graph shows the onset of key anatomical landmarks plotted in hpf for zebrafish (x-axis) and medaka (y-axis) throughout development (D). The main developmental sequence is indicated as a green dotted line. Red and blue dots represent heterochronic structures between both species. See also Supplemental Table S1. Bar = 100 µm. (fb) Forebrain, (hb) hindbrain, (ls) lens, (mb) midbrain, (mhb) midbrain-hindbrain boundary, (nr) neural retina, (ov) otic vesicle.


