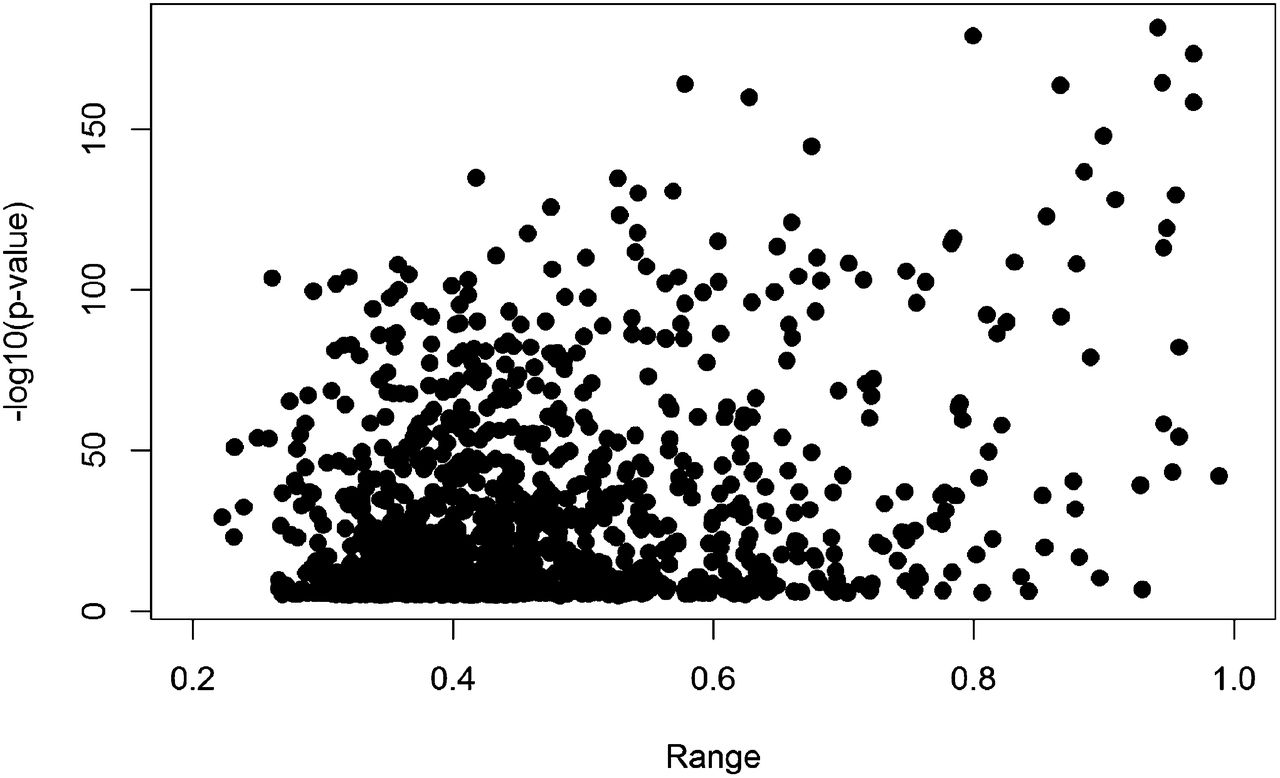
The effect of genotype and in utero environment on interindividual variation in neonate DNA methylomes

(Downloading may take up to 30 seconds. If the slide opens in your browser, select File -> Save As to save it.)

Click on image to view larger version.

Figure 7.
Figure 7.

VMR-CpGs with larger ranges of methylation values are more likely to be MethQTLs. Scatter plot showing the range of methylation values at each CpG across samples (x-axis) compared with the strength of association between the VMR-CpG methylation values and the genotype of the best SNP (y-axis).

This Article

  1. Genome Res. 24: 1064-1074

Preprint Server