
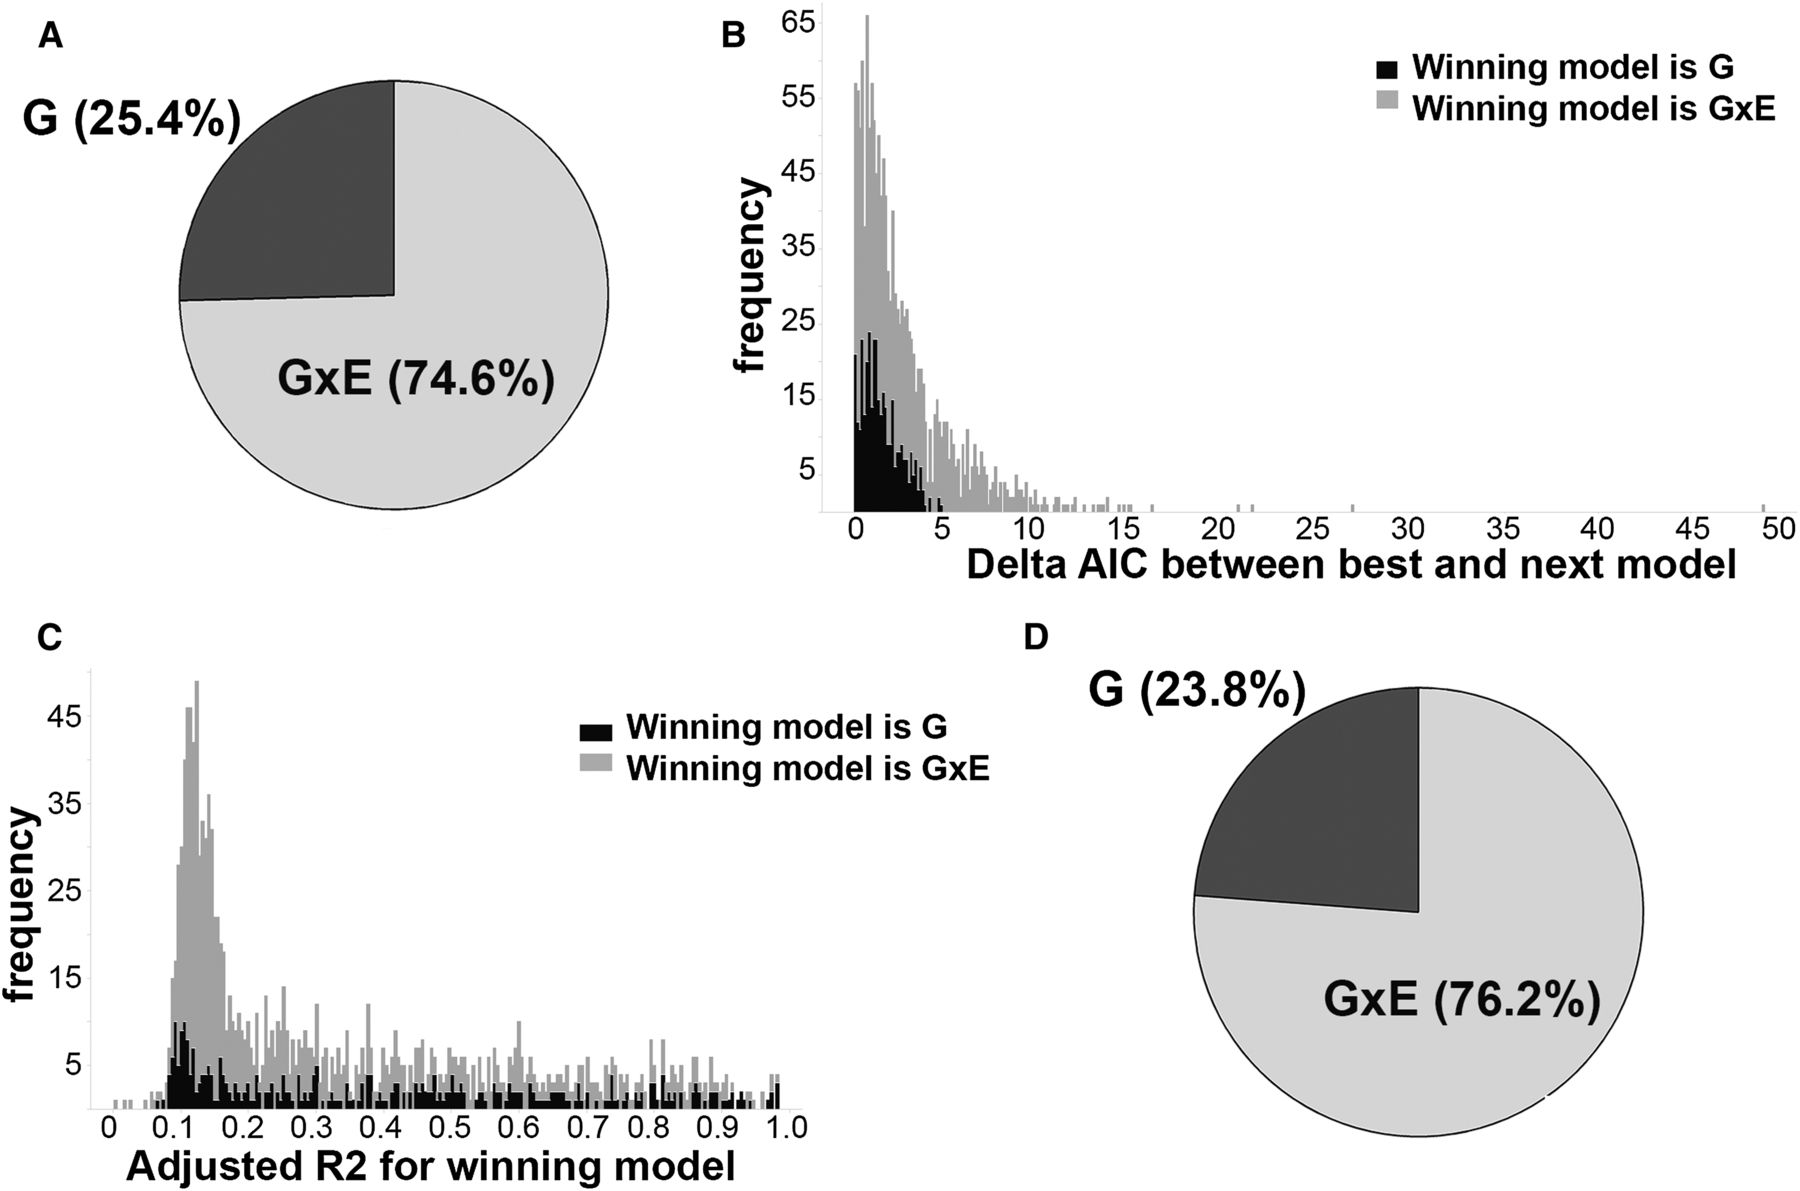
(A) The majority of VMR-CpGs are best explained by G × E models. Pie chart showing the proportions of 1423 VMR-CpGs, which are best explained by the genotype (G), environment, or interaction between gene and environment (G × E) regression models. (B) Genotype tends to be a narrow winner. Stacked histogram of deltas between delta AICs for best and next-best model across 1423 VMR-CpGs. Each box is colored to denote the model that best explained methylation levels at the VMR-CpG. (C) The models explain the range of variation at VMR-CpGs. Stacked histograms of adjusted R2 of the winning model across all 1423 VMR-CpGs. Each box is colored by the winning model. (D) The proportion of VMR-CpGs explained by G × E is stable as model confidence increases. Pie chart showing the proportions of 210 VMR-CpGs that were best explained by the genotype, environment, or G × E regression models with no substantial support for the next-best model (Δ > 2) and adjusted R2 > 0.4.


