
Figure 4.
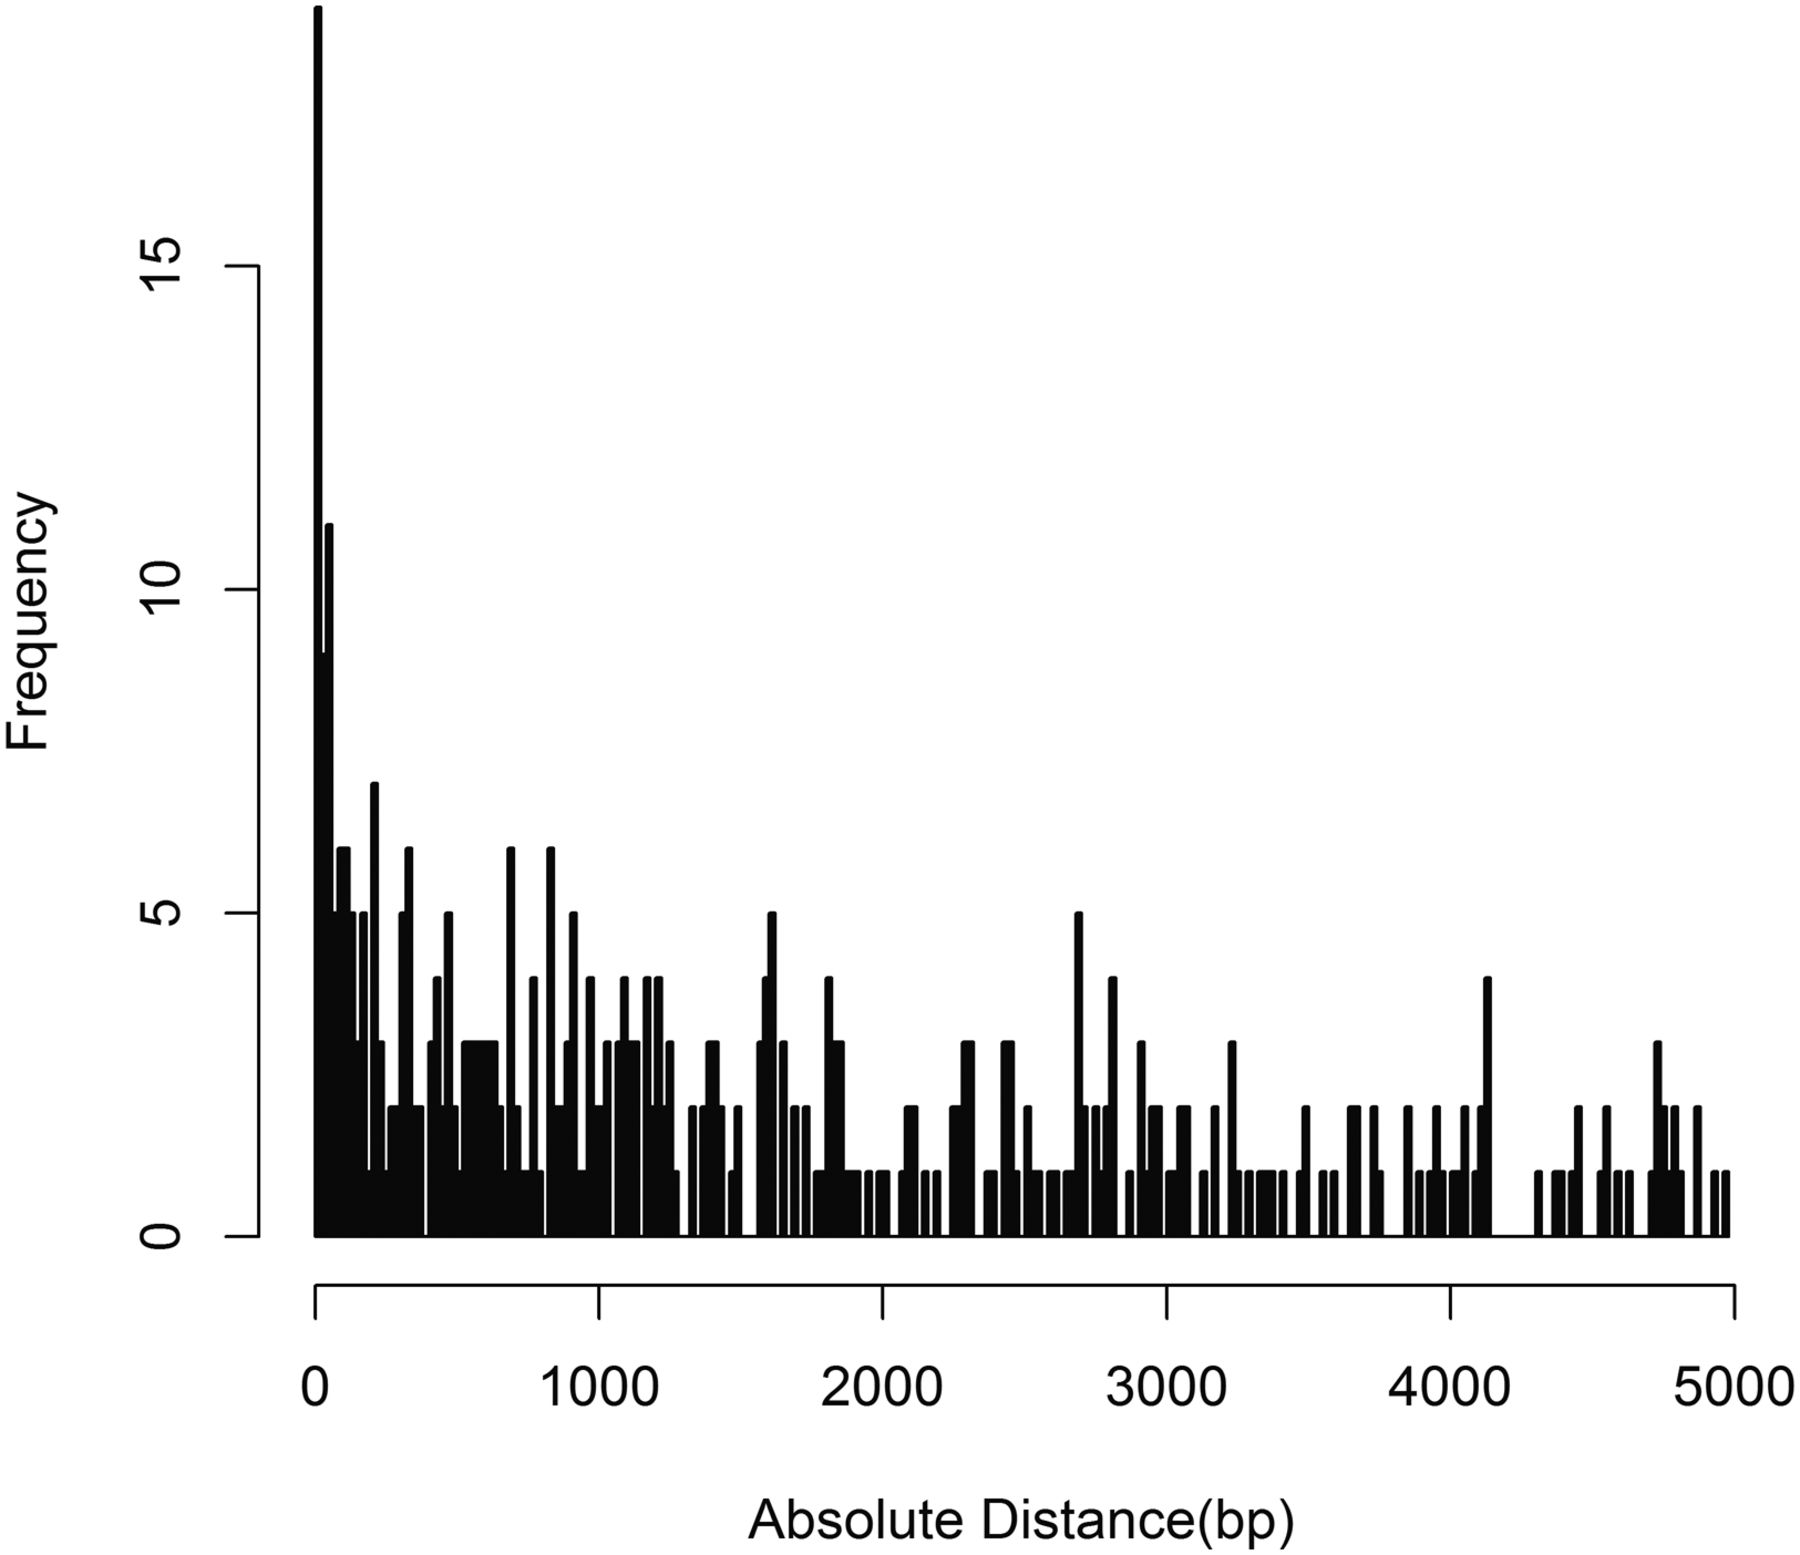
Cis pairs tend toward short distances between the SNP and CpG. Bar chart of –log10 of the P-value (y-axis) against the chromosomal distance between the SNP and CpG (x-axis) for cis pairs within 5 kb.
(Downloading may take up to 30 seconds. If the slide opens in your browser, select File -> Save As to save it.)
Click on image to view larger version.
Cis pairs tend toward short distances between the SNP and CpG. Bar chart of –log10 of the P-value (y-axis) against the chromosomal distance between the SNP and CpG (x-axis) for cis pairs within 5 kb.
 CiteULike
 Delicious
 Digg
Digg Facebook
 Google+
 Reddit
 Twitter
