
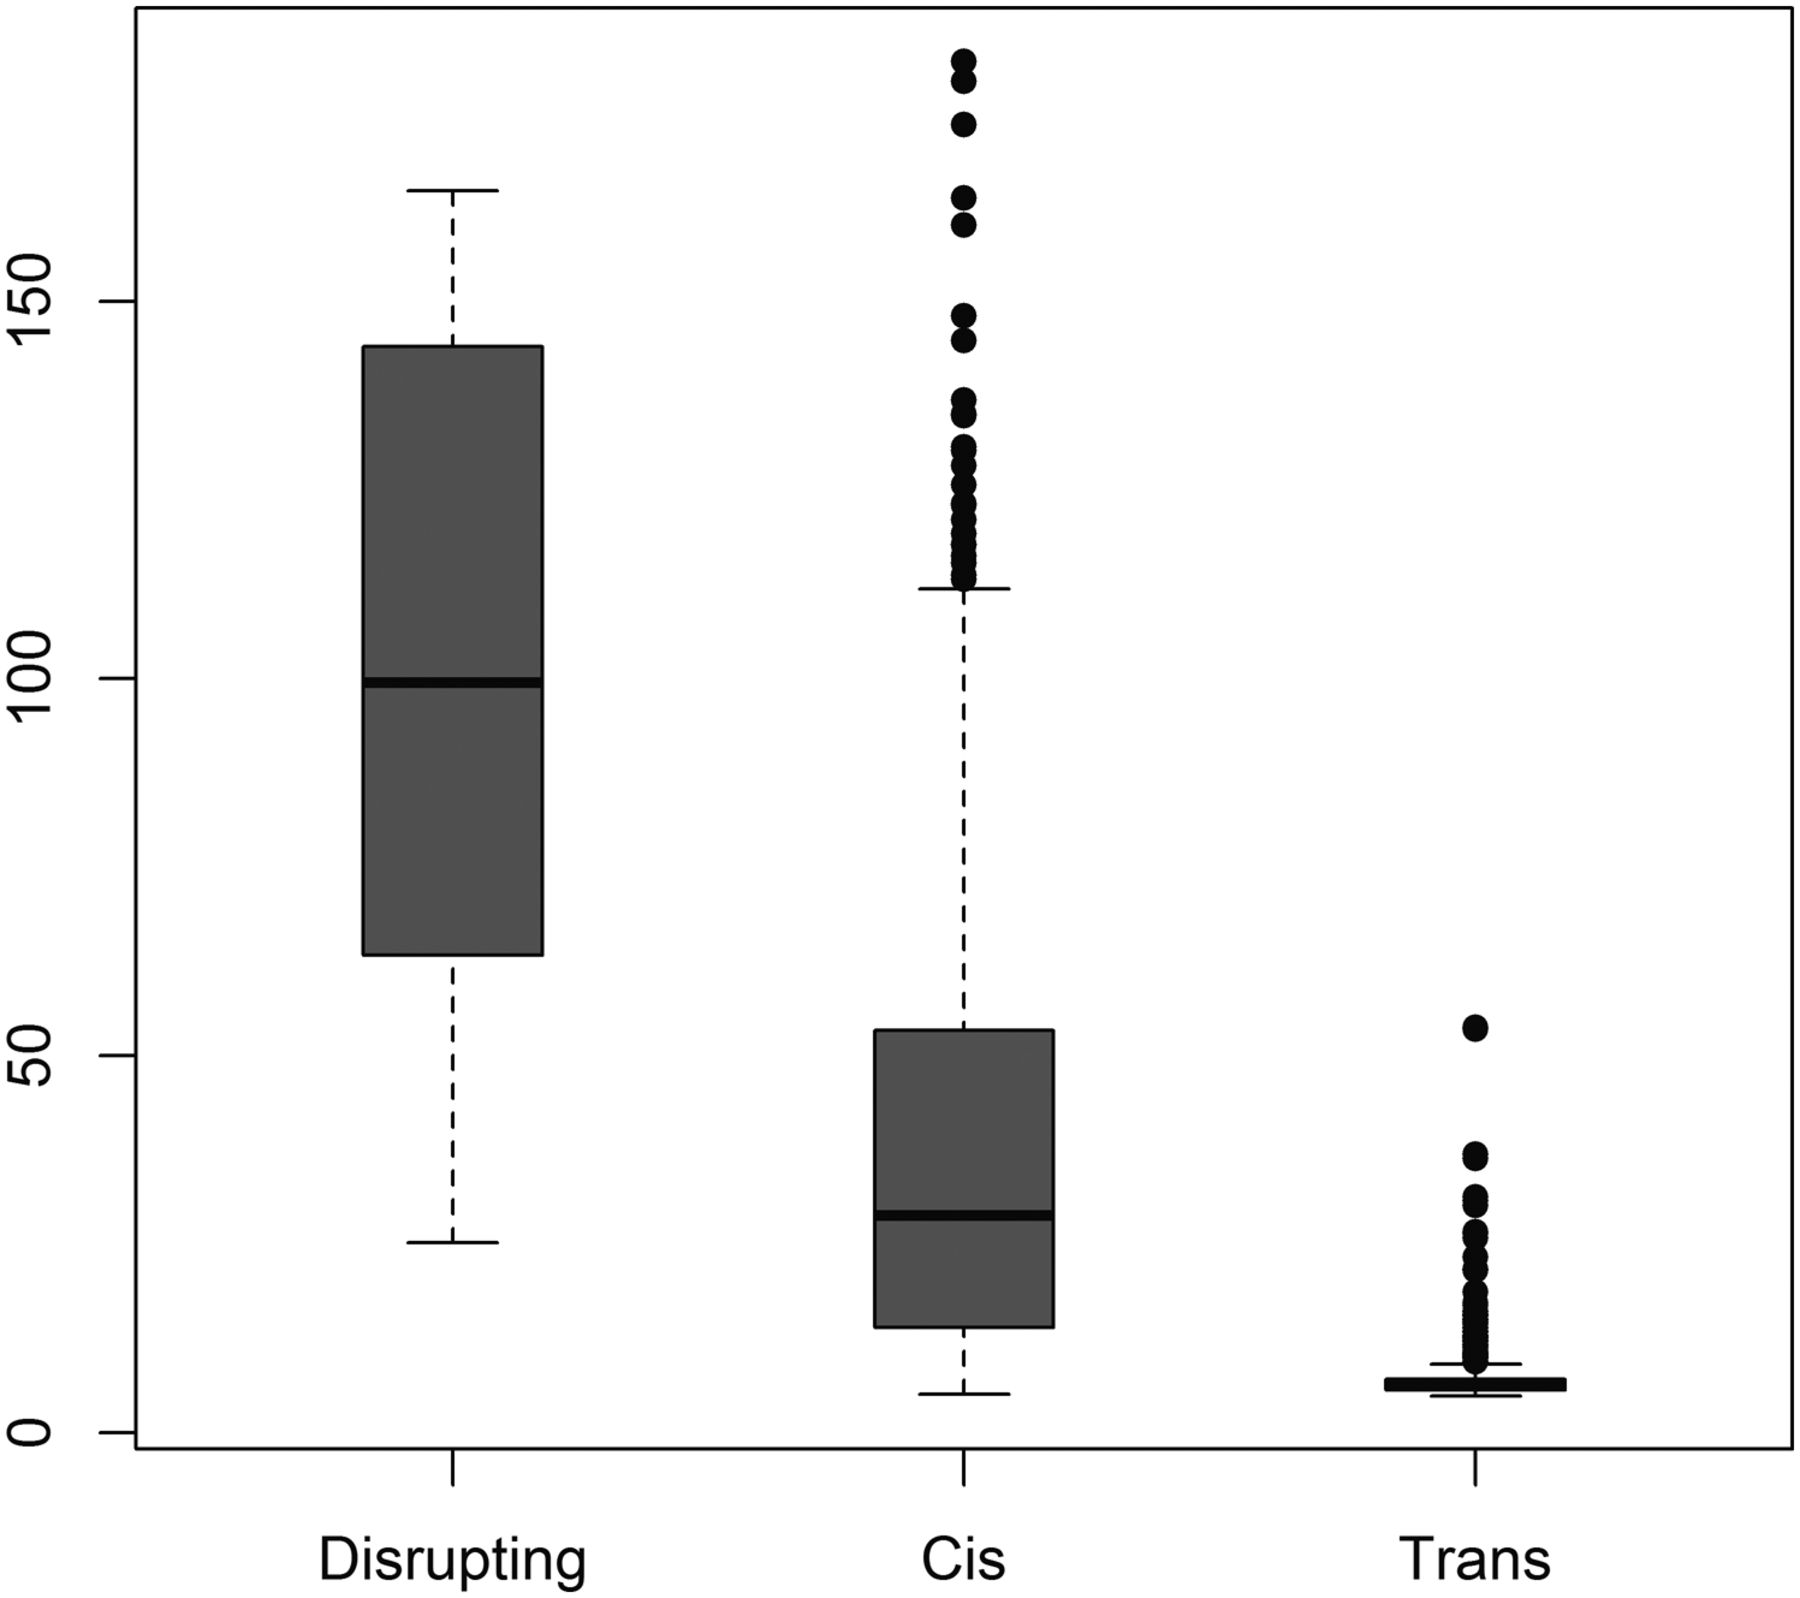
Figure 3.
The strength of association between genotype and methylation is strongest for disrupting pairs and weakest for trans pairs. Box plot of –log10 of the P-value of the association between genotype and methylation levels at each VMR-CpG, for CpG–SNP pair categories disrupting (SNP is within CpG), cis (SNP is on same chromosome as CpG), and trans (SNP is on a different chromosome to the CpG).


