
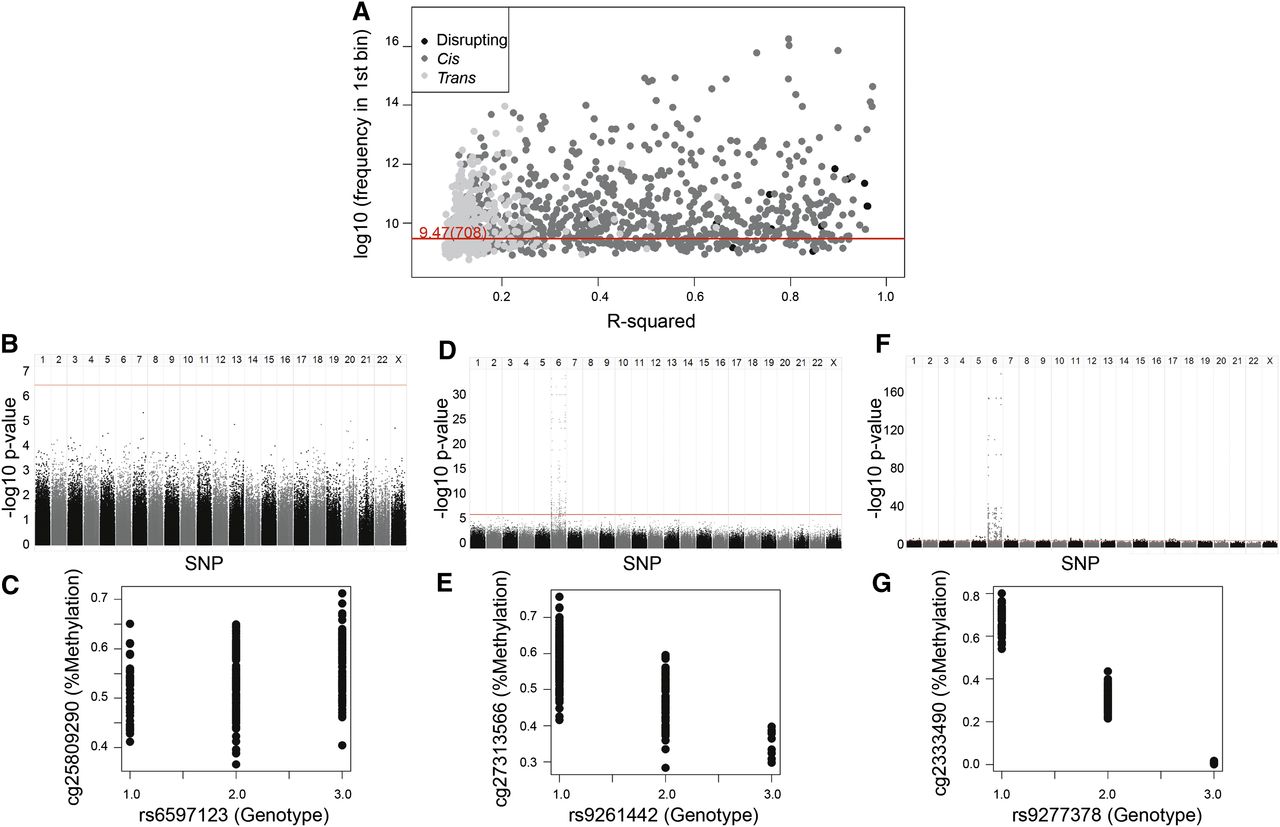
(A) The strength of association between genotype and methylation levels is a continuum, with most VMR-CpGs showing some association with genotype. Scatter plot of Pearson R2 (x-axis) for the VMR-CpG and best SNP match against log2 of the number of regression P-values in the first bin of 1000 equally distributed bins (y-axis); the red line represents an absolutely even 708 regression P-value in the first bin. (Black) Disrupting pairs, (dark gray) cis pairs, (light gray) trans pairs. (B) Some VMR-CpGs are minimally influenced by genotype. Manhattan plot of methylation at one VMR-CpG against all SNPs (x-axis) with −log10 P-value on the y-axis, as an example of VMR-CpG with low R2 and a low number of P-values in the first bin. (C) Scatter plot of genotype (x-axis) against methylation (y-axis) for the top pair from the same VMR-CpGs as in B. (D) Some VMR-CpGs are moderately influenced by genotype. Manhattan plot of methylation at one VMR-CpG against all SNPs (x-axis) with −log10 P-value on the y-axis, as an example of VMR-CpG with moderate R2 and a moderate number in the first bin. (E) Scatter plot of genotype (x-axis) against methylation (y-axis) for the top pair from the same VMR-CpGs as in D. (F) Manhattan plot of CpG against all SNPs (x-axis) with −log10 of the P-value (y-axis), as an example of VMR-CpG with high R2 and a high number in the first bin. (G) Scatter plot of genotype (x-axis) against methylation (y-axis) for the top pair from the same CpG as in F.


