
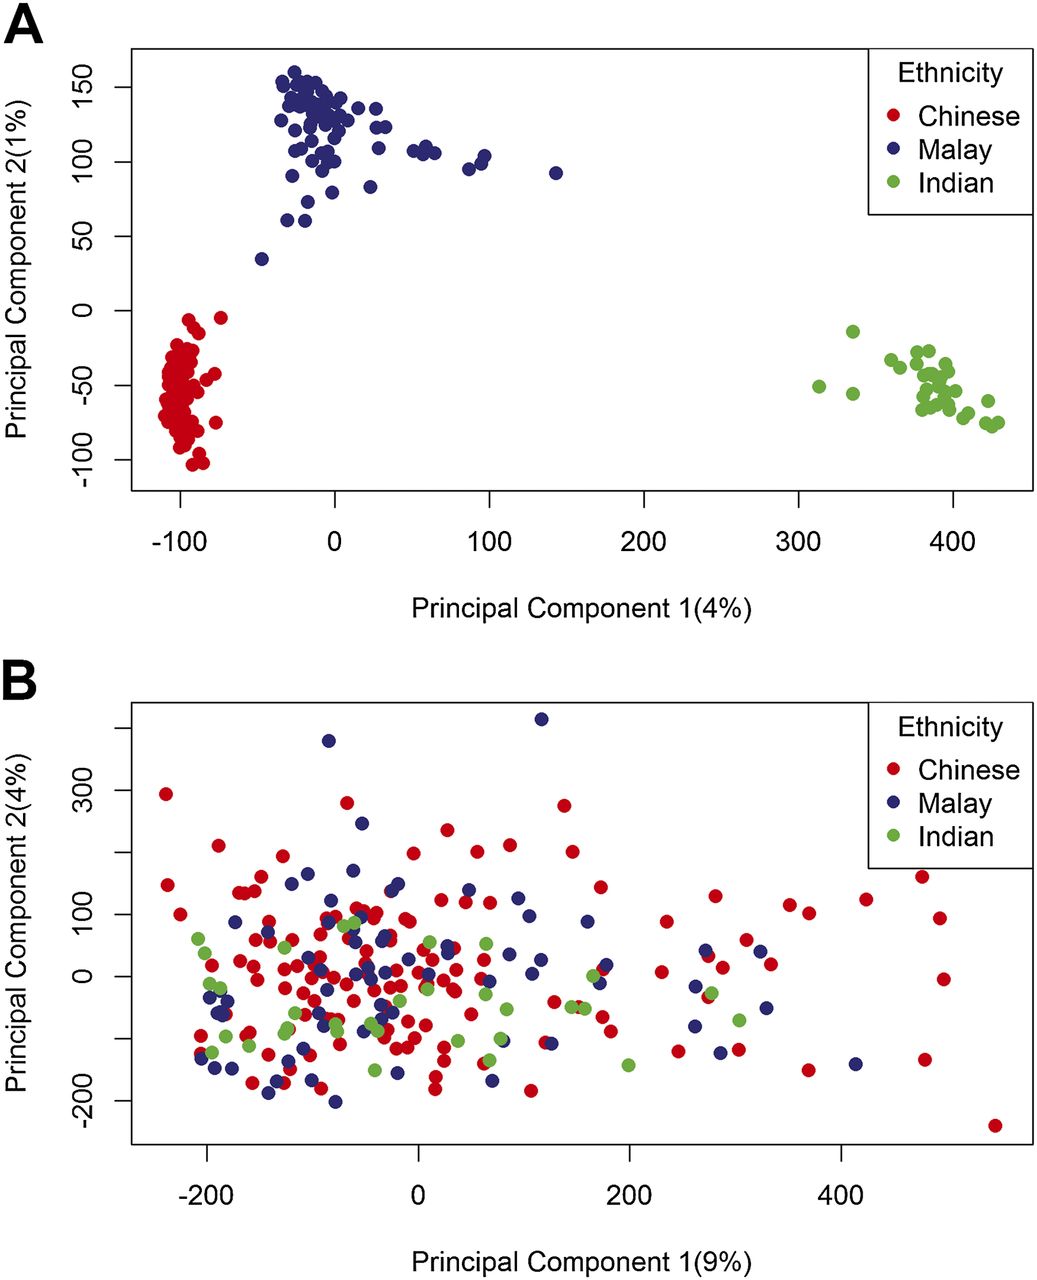
Figure 1.
(A) Unfiltered genotypes organize subjects by ethnicity. Principal component 1 (x-axis) plotted against principal component 2 (y-axis) from principal component analysis of genotypes for all 708,365 heterologous SNPs across 237 subjects. Subjects are colored by self-reported ethnicity. (B) Unfiltered methylomes do not organize subjects by ethnicity. Principal component 1 (x-axis) plotted against principal component 2 (y-axis) for principal component analysis of methylation levels at all 301,468 variable CpGs across 237 subjects. Subjects are colored by self-reported ethnicity.


