
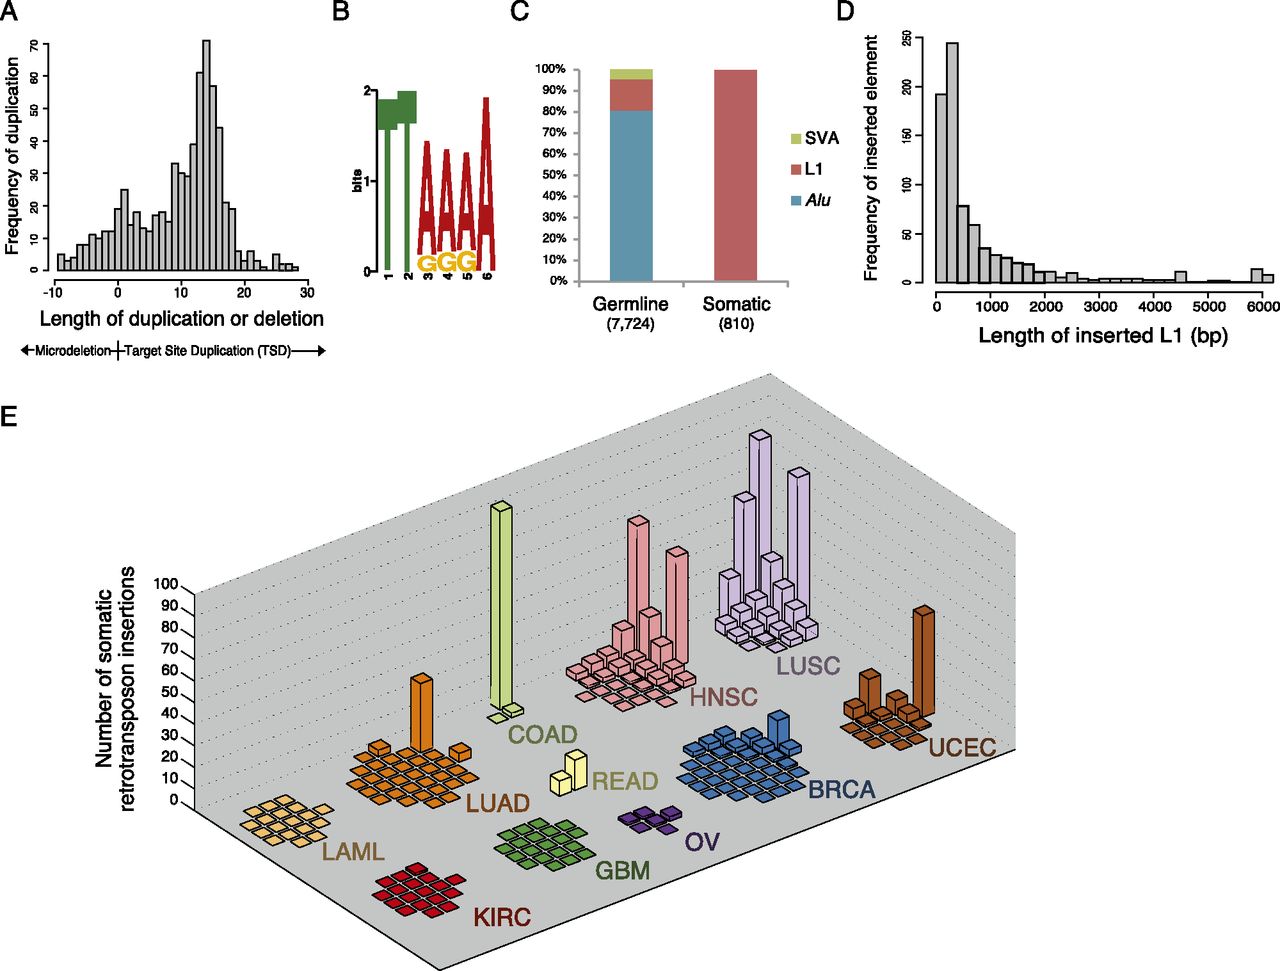
Landscape of retrotransposon insertions across cancer reveals a tumor-type specific pattern. (A) Distribution of duplication or deletion lengths at sites of somatic retrotransposon insertion. Target-site duplication (TSD) lengths are sequence duplications of positive length, while microdeletions at the breakpoint are plotted as negative values according to the length of the deletion. See Supplemental Figure 3A for an analogous plot of germline retrotransposon insertions. (B) A sequence logo of the consensus motif at the predicted breakpoints of somatic retrotransposon insertions. See Supplemental Figure 3B for germline insertion sequence motif. (C) Percentage of each retrotransposon family inserted in both tumor and matched normal (germline) and only in tumor (somatic) across all samples. (D) Length of somatically inserted L1 element (see Supplemental Fig. 3C for germline). (E) Distribution of somatic retrotransposon insertion events per individual across all tumor types. For each tumor type, the vertical axis displays the number of somatic retrotransposon events identified within each individual queried. These data are whole-genome sequences from 200 individuals collected and sequenced through The Cancer Genome Atlas, across 11 tumor types: lung adenocarcinoma (LUAD), lung squamous cell carcinoma (LUSC), ovarian carcinoma (OV), rectal adenocarcinoma (READ), colon adenocarcinoma (COAD), kidney clear cell carcinoma (KIRC), uterine corpus endometrioid carcinoma (UCEC), head and neck squamous cell carcinoma (HNSC), breast carcinoma (BRCA), acute myeloid leukemia (LAML), and glioblastoma multiforme (GBM). See Supplemental Figure 4, A and B, for other representations of these data.


