
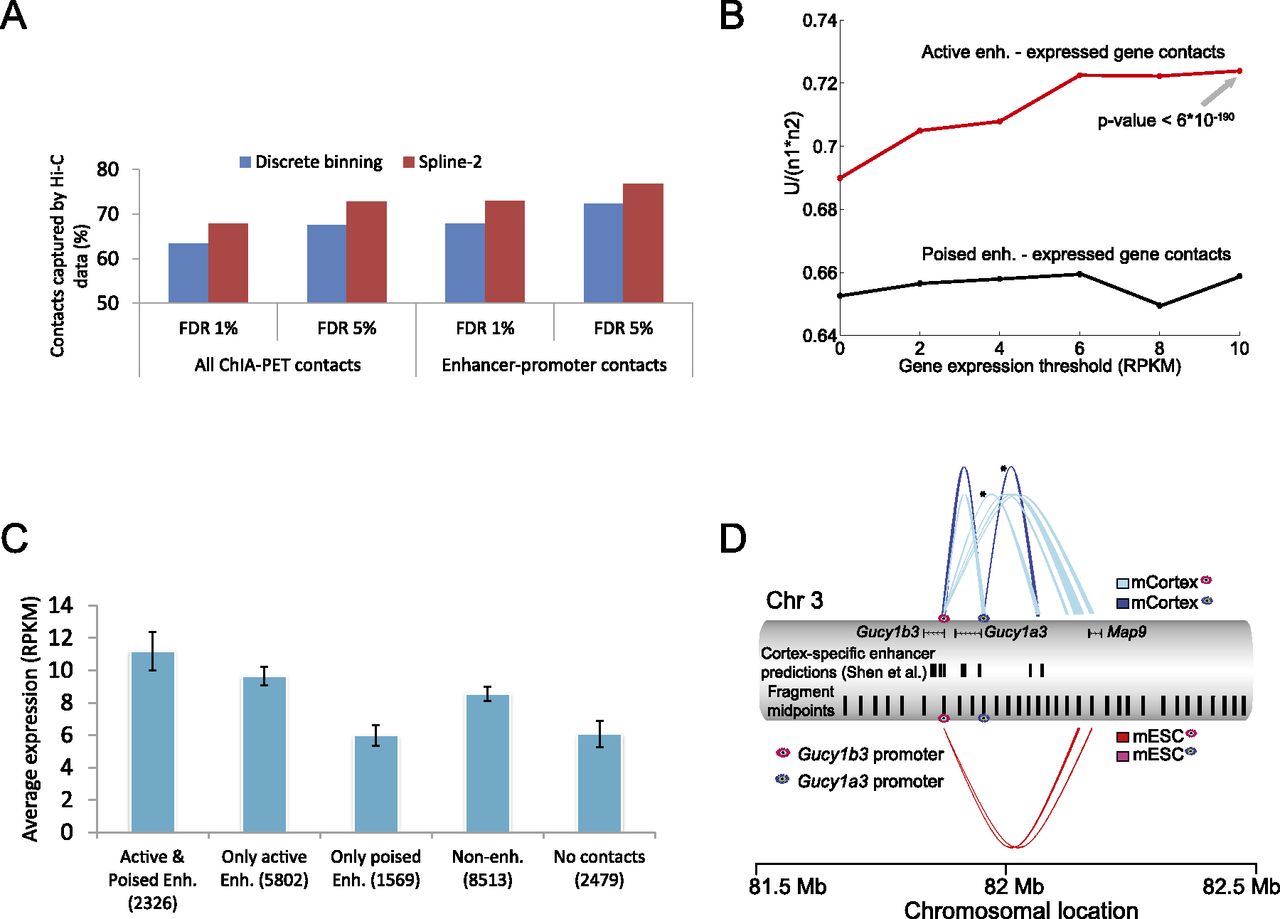
Fit-Hi-C identifies high-confidence contacts between previously predicted/validated enhancer-promoter pairs. (A) Percentage of RNAPII-mediated chromatin interactions identified by Zhang et al. (2013) in mouse ESCs that are captured either using our method (spline-2) or the discrete binning approach of Duan et al. (2010) from mESC Hi-C data at different FDR thresholds. A total of 1007 enhancer-promoter contacts and 2494 contacts between any two RNAPII binding peaks are extracted from Zhang et al. (2013) by limiting our analysis to mid-range contacts in the genomic distance interval of (50 kb, 5 Mb]. (B) Normalized Mann-Whitney U statistics for predicted locus pairs sorted by statistical significance, where “positive” pairs link an active enhancer (red line) or a poised enhancer (black line) to a gene expressed at least at the level given on the x-axis. The P-value of the Mann-Whitney test is shown for rejecting the null hypothesis that highly expressed genes (RPKM > 10) are not linked to active enhancers by Fit-Hi-C with Q-values lower than chance. (C) Average expression values and their standard errors for five nonoverlapping gene groups for the hESC cell line. The first three groups are defined according to the presence of contacts at FDR 1% from gene promoters to either or both active and poised enhancers. The remaining genes (i.e., genes with no contacts at FDR 1% to any annotated enhancer) are further segregated into two groups depending on whether their promoters have at least one contact at FDR 10% to some loci (“Non-enh”) or no contacts to any loci even at FDR 10% (“No contacts”). The first two groups of genes with at least one contact with an active enhancer show similar expression profiles regardless of the presence/absence of a contact with a poised enhancer (P-value of 0.92, two-sample Kolmogorov-Smirnov test). Genes that have a contact with an active enhancer show significantly higher expression compared to genes in all three groups that lack such contacts (P-values of 4 × 10⁻¹⁰, 0.0014, and 1.5 × 10−45 for “Only poised enh,” “Non-enh,” and “No contacts,” respectively). (D) Contact profiles at FDR 0.1% for promoter regions of two genes (Gucy1b3 and Gucy1a3) that show differential expression between two mouse cell lines (mESC and mCortex). Each connector represents a significant contact with thickness proportional to the minus log(P-value) of the contact. The connector colors indicated in square boxes are determined jointly by the cell line (mESC or mCortex) and by the gene promoter of interest (magenta oval for Gucy1b3, blue oval for Gucy1a3). No pink connectors are drawn from the promoter of Gucy1a3 due to the lack of significant contacts involving this promoter in mESCs. Cortex-specific enhancer elements predicted by Shen et al. (2012) and midpoints of each of the 10 consecutive restriction fragments are shown as two separate tracks. Contact confidences are assigned by Fit-Hi-C using ICE-corrected contact maps. A similar figure is also generated using raw contact maps (Supplemental Fig. 6).


