
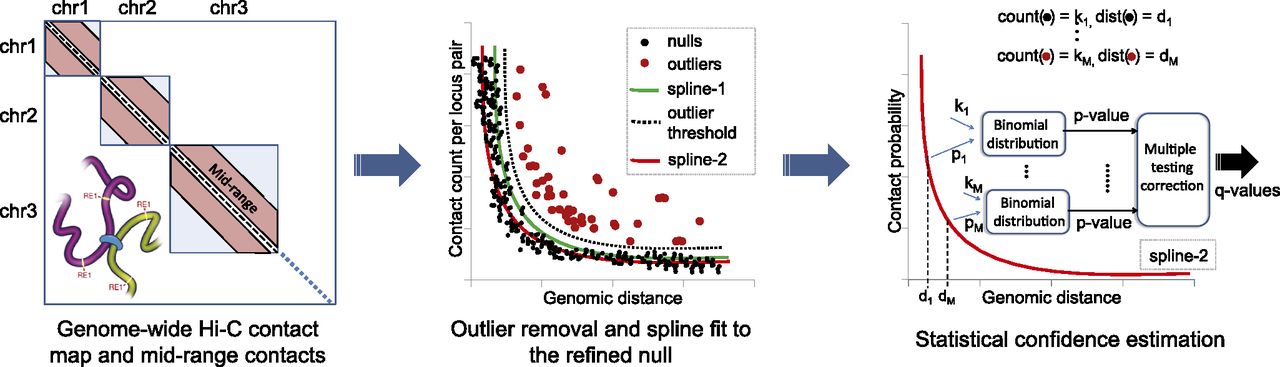
Assigning statistical confidence estimates to mid-range contacts using Fit-Hi-C. Cross-linking and digestion from a Hi-C assay produces a genome-wide contact map. We extract intra-chromosomal contacts in the range of (10 kb, 250 kb] for the yeast genome and (50 kb, 10 Mb] for the human and mouse genomes. We fit an initial spline (spline-1) using the observed contact counts and genomic distances between all possible mid-range locus pairs. The general shape of the spline is assumed to be due to random polymer looping and is the basis for the initial null model. This initial spline determines a threshold (dashed line) to identify outliers (red dots) which are excluded from the calculation of a refined null represented by a second spline (spline-2). For each mid-range locus pair, we estimate the prior contact probability from spline-2 using the exact genomic distance between the loci in the pair. We calculate P-values for all contacts, including null and outlier pairs, by using a binomial distribution and apply multiple hypothesis testing correction to compute a Q-value for each P-value.


