
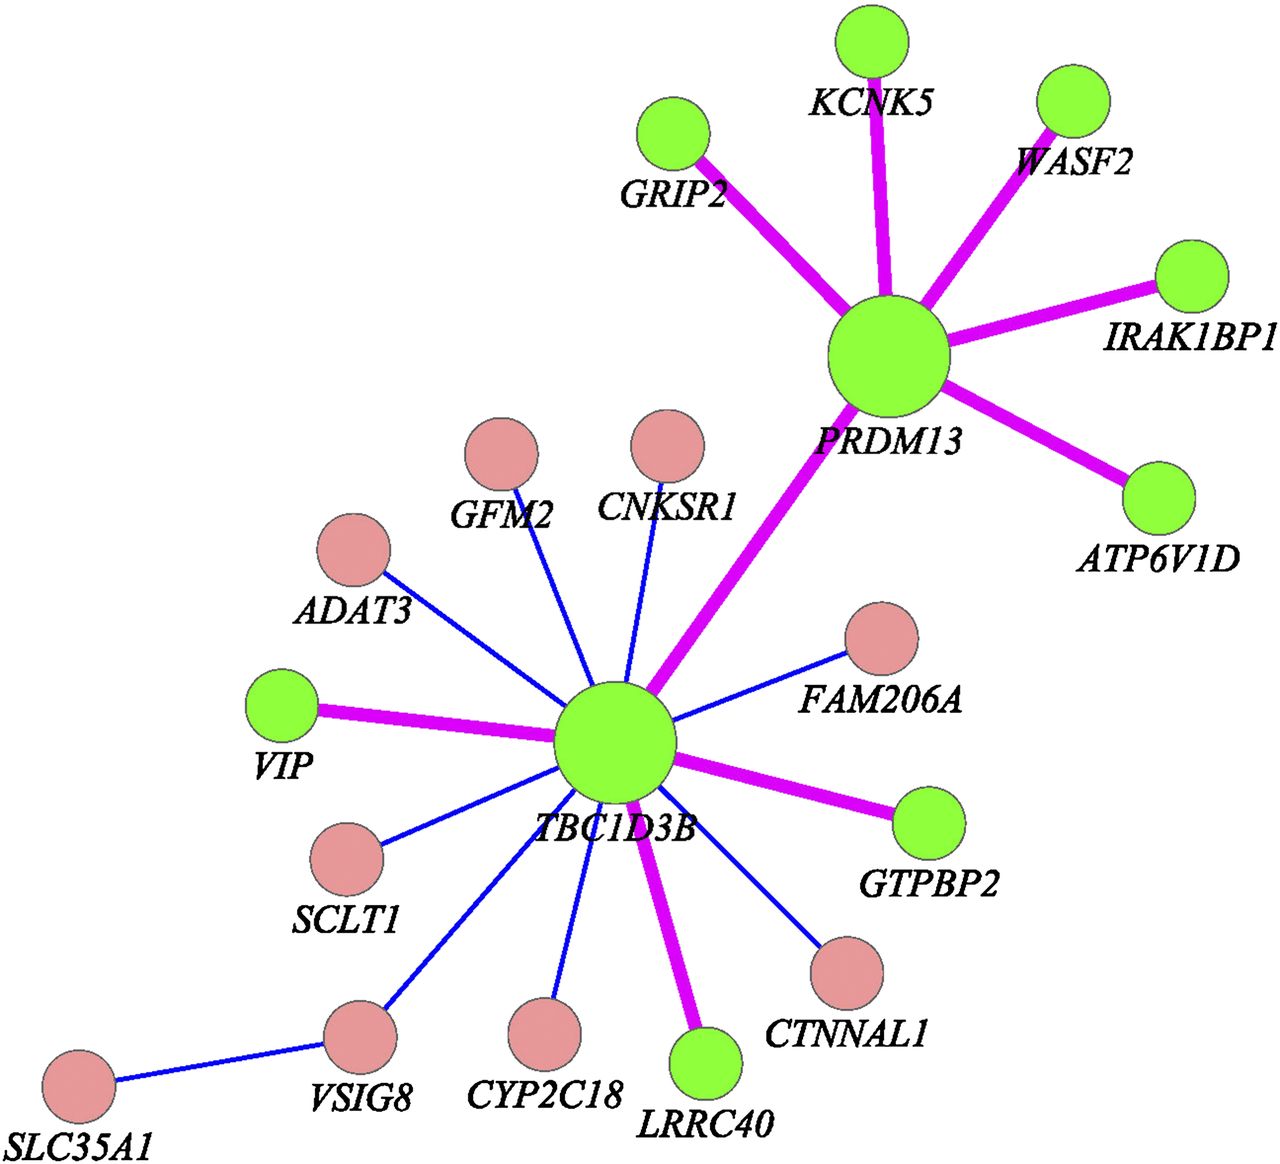
Figure 4.
Nine interactions (pink color) between genes (green color) which form a subnetwork were replicated in the NHLBI’s ESP and CHARGE-S studies.
(Downloading may take up to 30 seconds. If the slide opens in your browser, select File -> Save As to save it.)
Click on image to view larger version.
Nine interactions (pink color) between genes (green color) which form a subnetwork were replicated in the NHLBI’s ESP and CHARGE-S studies.
 CiteULike
 Delicious
 Digg
Digg Facebook
 Google+
 Reddit
 Twitter
