
Figure 3.
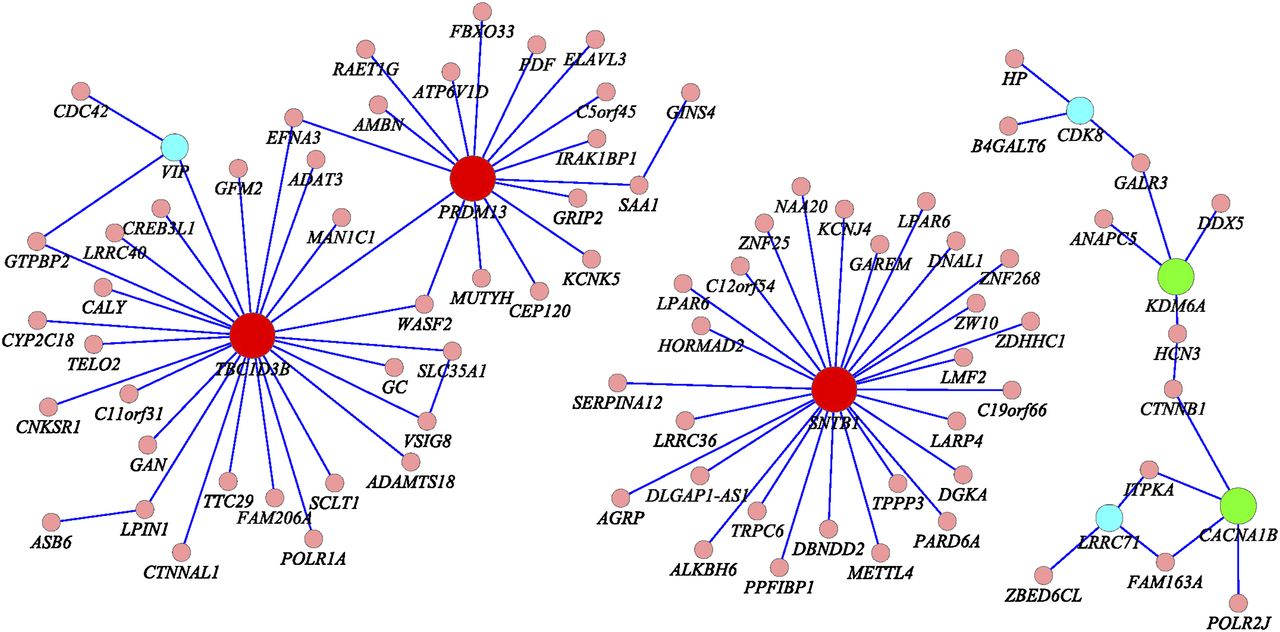
Networks of 27 pairs of genes showing significant evidence of interactions and genes showing mild interactions in Supplemental Table S5.
(Downloading may take up to 30 seconds. If the slide opens in your browser, select File -> Save As to save it.)
Click on image to view larger version.
Networks of 27 pairs of genes showing significant evidence of interactions and genes showing mild interactions in Supplemental Table S5.
 CiteULike
 Delicious
 Digg
Digg Facebook
 Google+
 Reddit
 Twitter
