
Figure 2.
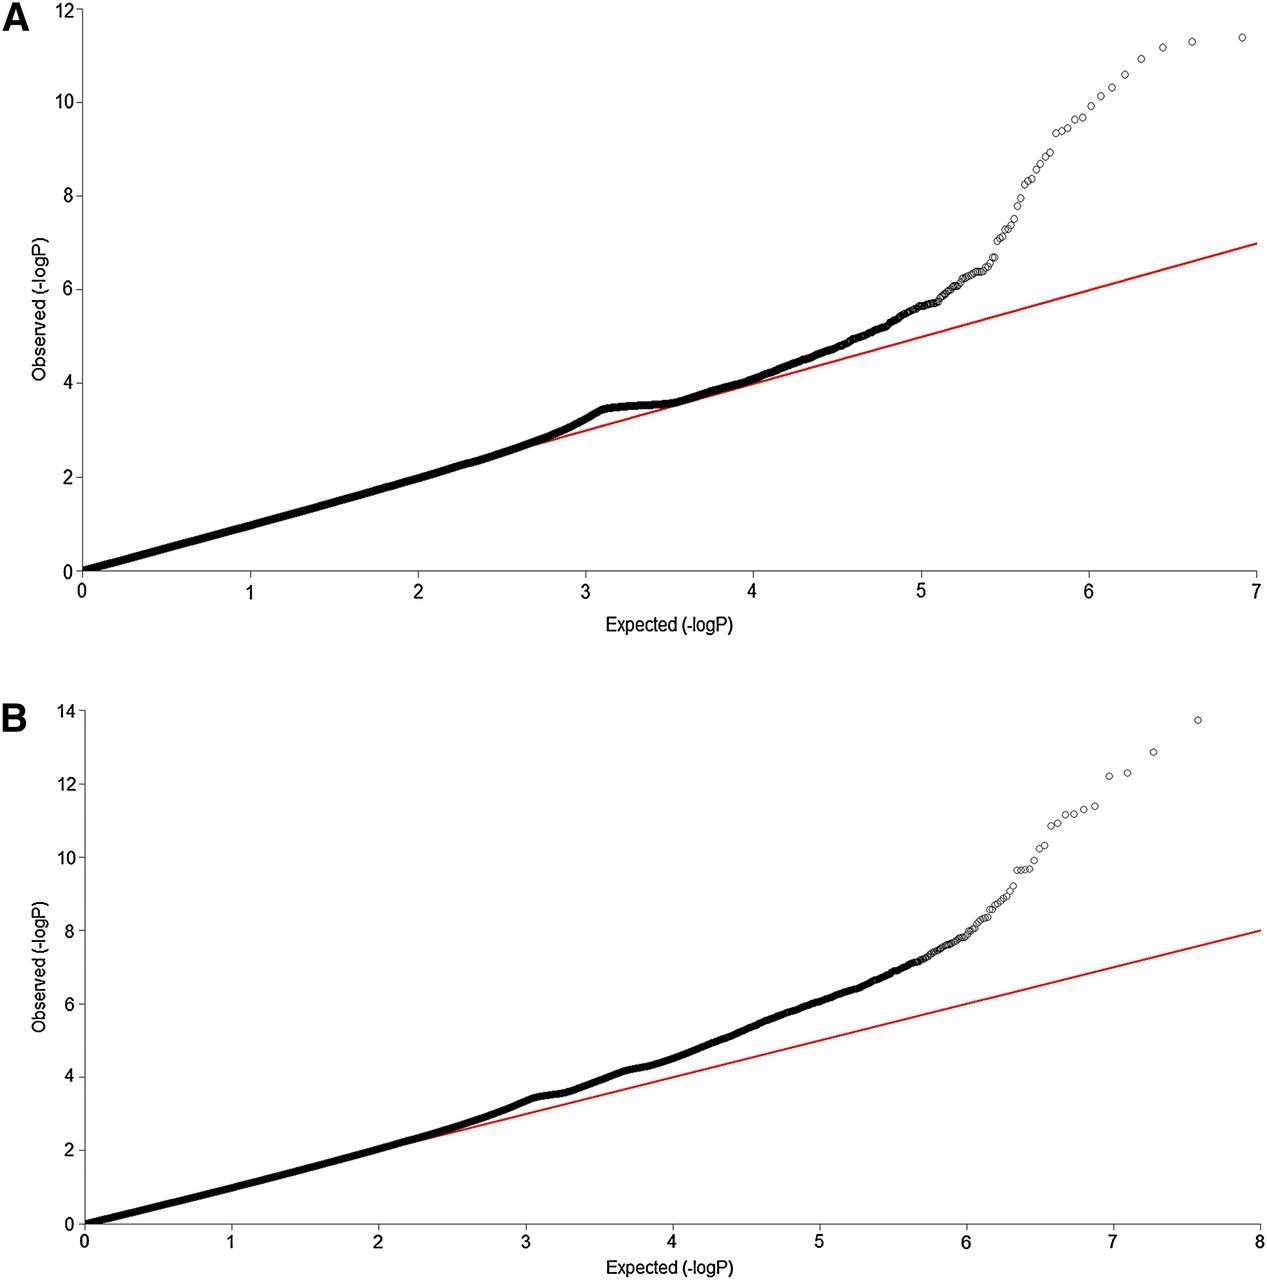
(A) QQ plot for the ESP data set. (B) QQ plot for the CHARGE-S data set.
(Downloading may take up to 30 seconds. If the slide opens in your browser, select File -> Save As to save it.)
Click on image to view larger version.
(A) QQ plot for the ESP data set. (B) QQ plot for the CHARGE-S data set.
 CiteULike
 Delicious
 Digg
Digg Facebook
 Google+
 Reddit
 Twitter
