
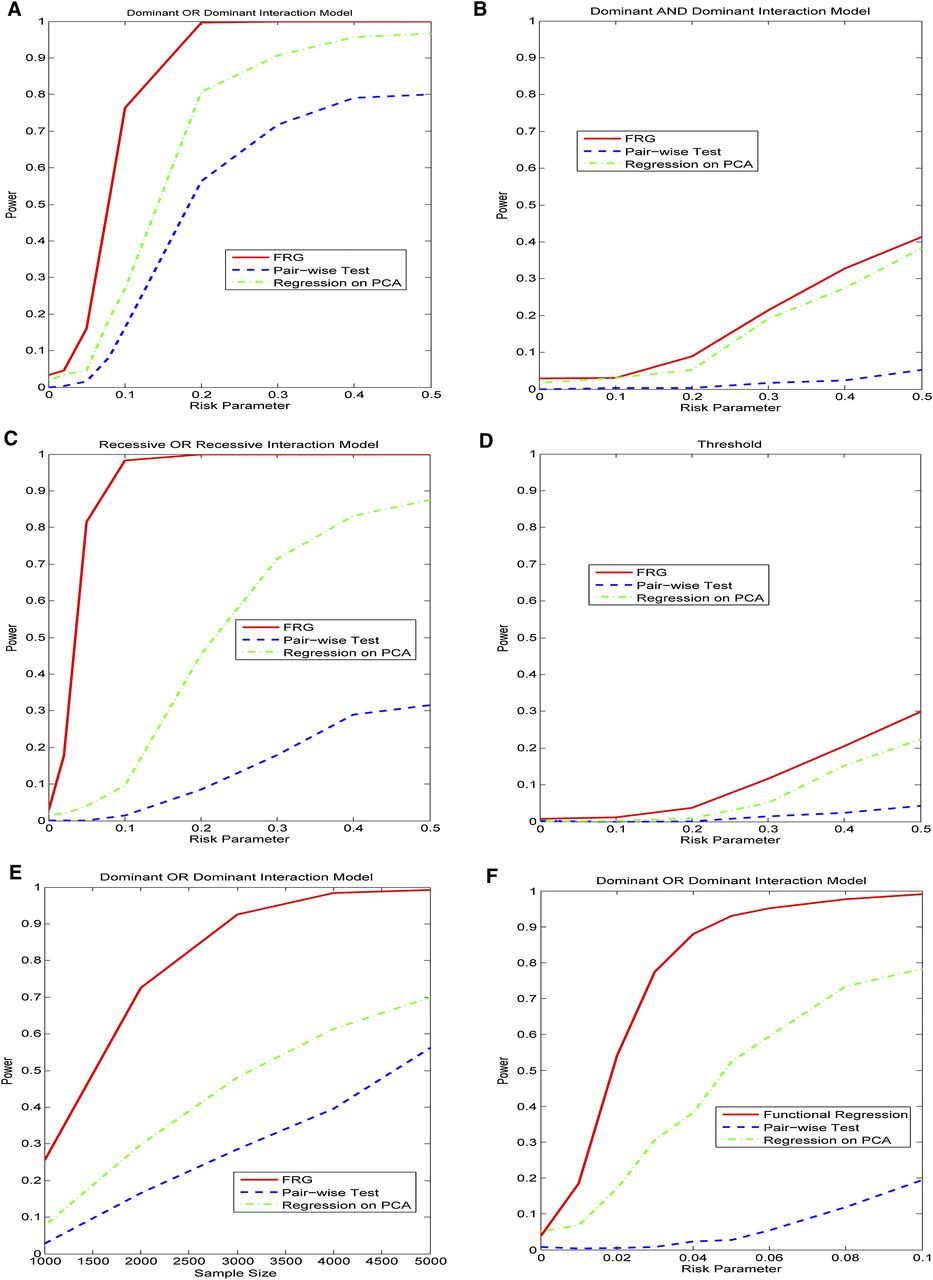
(A) Power curves of three statistics: the FRG, the regression on PCA, and pairwise interaction tests. Permutations were used to adjust for multiple testing, that is, for testing the interaction between two genomic regions that consist of rare variants, for a quantitative trait as a function of the relative risk parameter r at the significance level α = 0.05, under the Dominant OR Dominant model, assuming sample sizes of 2000. (B) Power curves of three statistics: the FRG, the regression on PCA, and pairwise interaction tests. Permutations were used to adjust for multiple testing, that is, for testing the interaction between two genomic regions that consist of rare variants, for a quantitative trait as a function of the relative risk parameter r at the significance level α = 0.05, under the Dominant AND Dominant model, assuming sample sizes of 2000. (C) Power curves of three statistics: the FRG, the regression on PCA, and pairwise interaction tests. Permutations were used to adjust for multiple testing, that is, for testing the interaction between two genomic regions that consist of rare variants, for a quantitative trait as a function of the relative risk parameter r at the significance level α = 0.05, under the Recessive OR Recessive model, assuming sample sizes of 2000. (D) Power curves of three statistics: the FRG, the regression on PCA, and pairwise interaction tests. Permutations were used to adjust for multiple testing, that is, for testing the interaction between two genomic regions that consist of rare variants, for a quantitative trait as a function of the relative risk parameter r at the significance level α = 0.05, under the Threshold model, assuming sample sizes of 2000. (E) Power curves of three statistics: the FRG, the regression on PCA, and pairwise interaction tests. Permutations were used to adjust for multiple testing, that is, for testing the interaction between two genomic regions that consist of rare variants, for a quantitative trait as a function of the sample size at the significance level α = 0.05, under the Dominant OR Dominant model, assuming the relative risk parameter r = 0.1. (F) Power curves of three statistics: the FRG, the regression on PCA, and pairwise interaction tests. Permutations were used to adjust for multiple testing, that is, for testing the interaction between two genomic regions with both common and rare variants, where 10% of the common variants and 10% of the rare variants were chosen as causal variants, as a function of the relative risk parameter r at the significance level α = 0.05, under the Dominant OR Dominant model, assuming sample sizes of 2000.


