
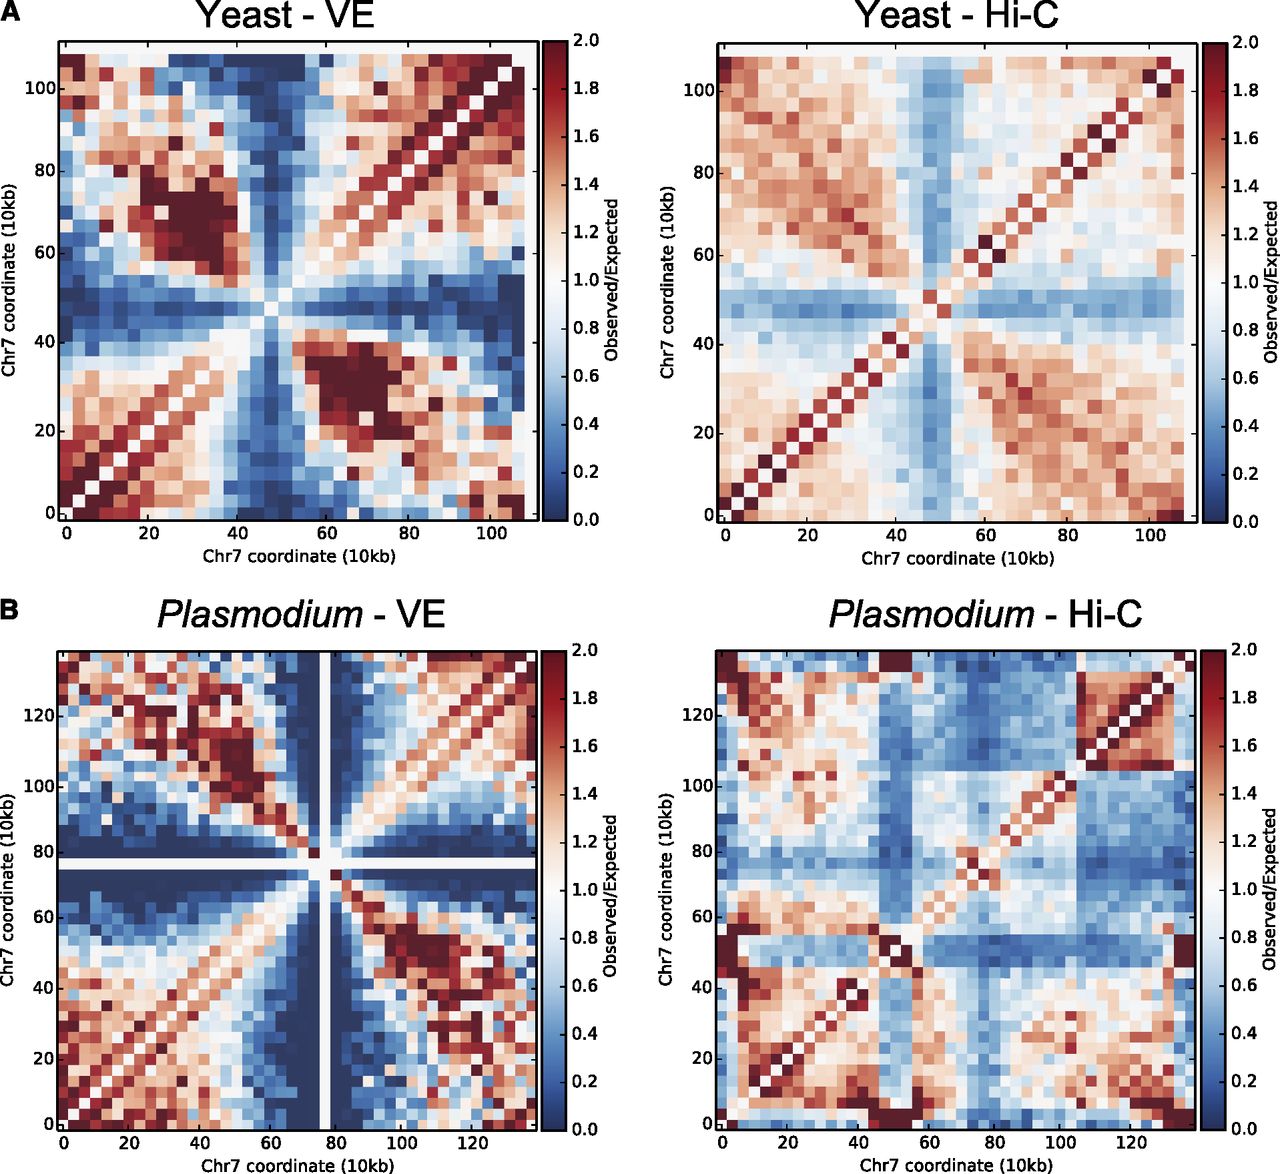
Figure 4.
Volume exclusion modeling. Observed/expected contact frequency matrices illustrate, for each locus, either the depletion (blue) or enrichment (red) of interaction frequencies compared with what would be expected given their genomic distances. (A) Observed/expected contact frequency matrices derived from S. cerevisiae chr 7 from volume exclusion modeling (left) and Hi-C data (right). (B) Observed/expected matrices from volume exclusion modeling (left) and Hi-C data (right) for P. falciparum chr 7 during the trophozoite stage.


