
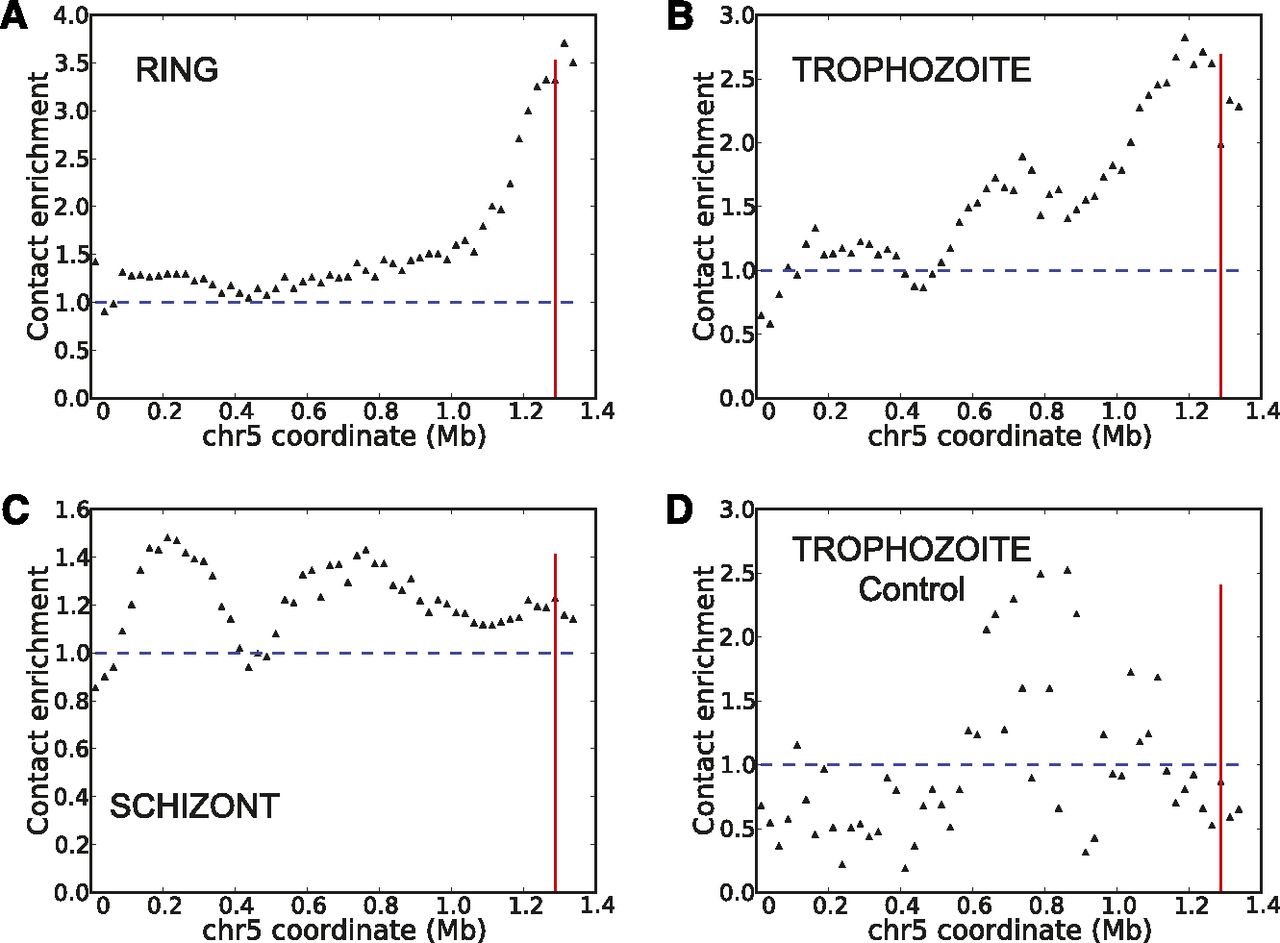
Colocalization of highly transcribed rDNA units. Virtual 4C plots generated at 25-kb resolution using as bait the A-type rDNA unit on chromosome 7 from cross-linked Hi-C libraries of ring (A), trophozoite (B), schizont stages (C), and from the trophozoite control library (D). Vertical red line indicates the midpoint of the A-type rDNA unit on chromosome 5. Normalized contact counts from 50 kb upstream of and downstream from the 25-kb bin containing the rDNA unit are used, omitting the rDNA-containing window itself to exclude repetitive DNA. For each window w on chromosome 5, the contact enrichment is calculated by dividing the contact count between the bait and w to the average interchromosomal contact count for the bait locus.


