
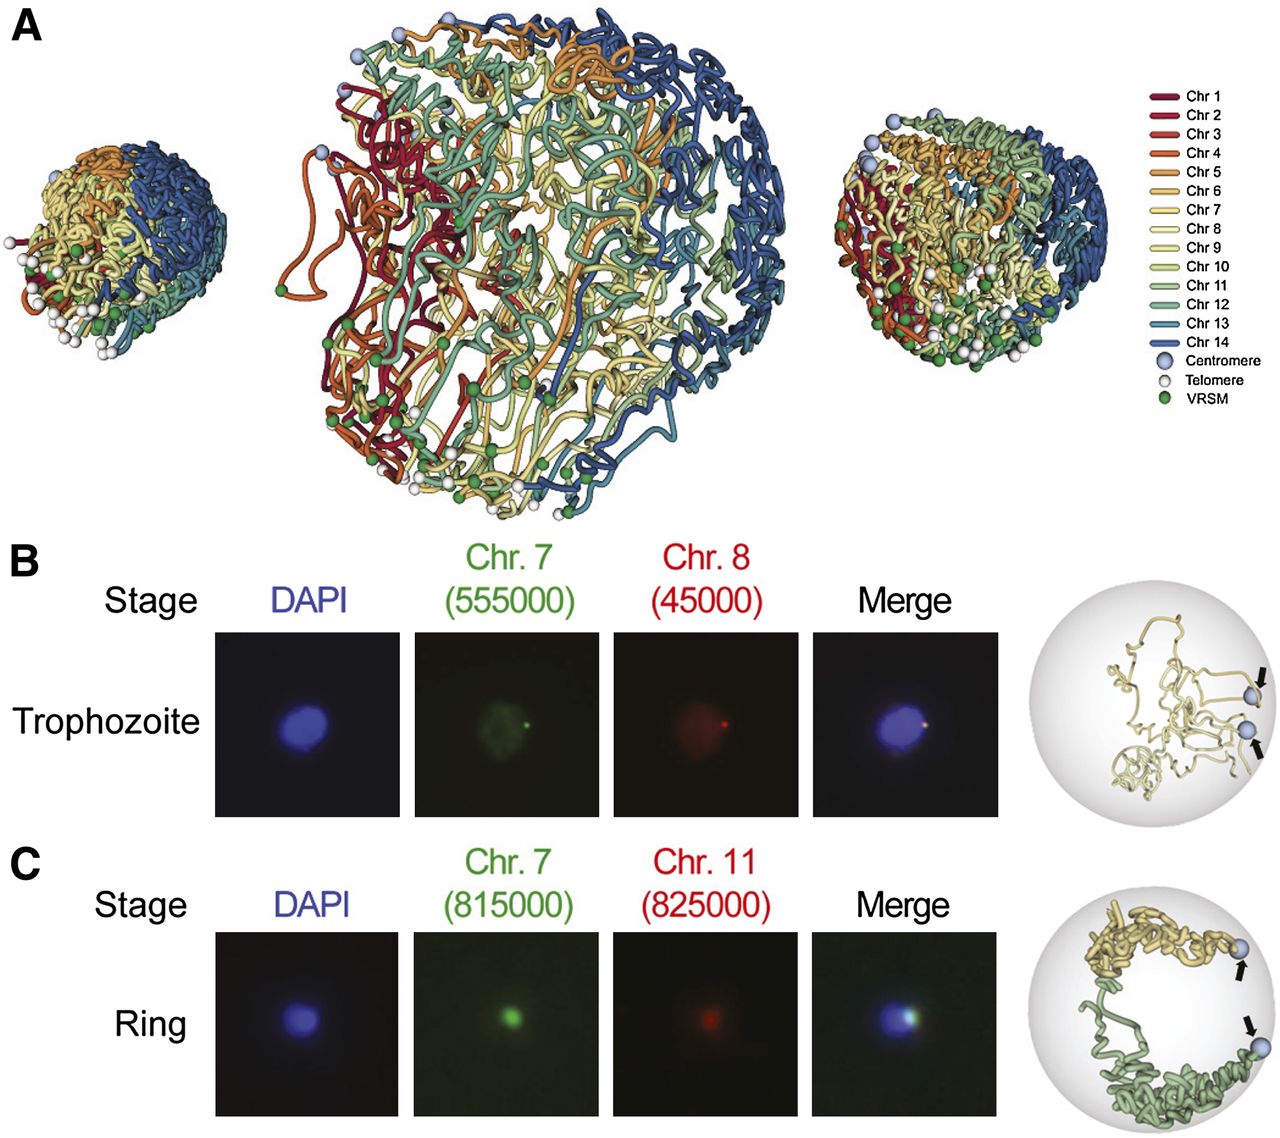
3D modeling and validation with DNA FISH. (A) 3D structures of all three stages. The nuclear radii used to model ring, trophozoite, and schizont stages were 350, 850, and 425 nm, respectively. Centromeres and telomeres are indicated with light-blue and white spheres, respectively. Midpoints of VRSM gene clusters are shown with green spheres. (B) Validation of colocalization between a pair of interchromosomal loci with VRSM genes (chr7: 550,000–560,000 that harbors internal VRSM genes and chr8: 40,000–50,000 that harbors subtelomeric VRSM genes) by DNA FISH (left) and by the three-dimensional model for the corresponding stage (right). The location of the loci in the 3D model is shown with light-blue spheres and indicated by black arrows. (C) Validation same as in B for a pair of interchromosomal loci that harbor no VRSM genes (chr7: 810,000–820,000 and chr11: 820,000–830,000).


