
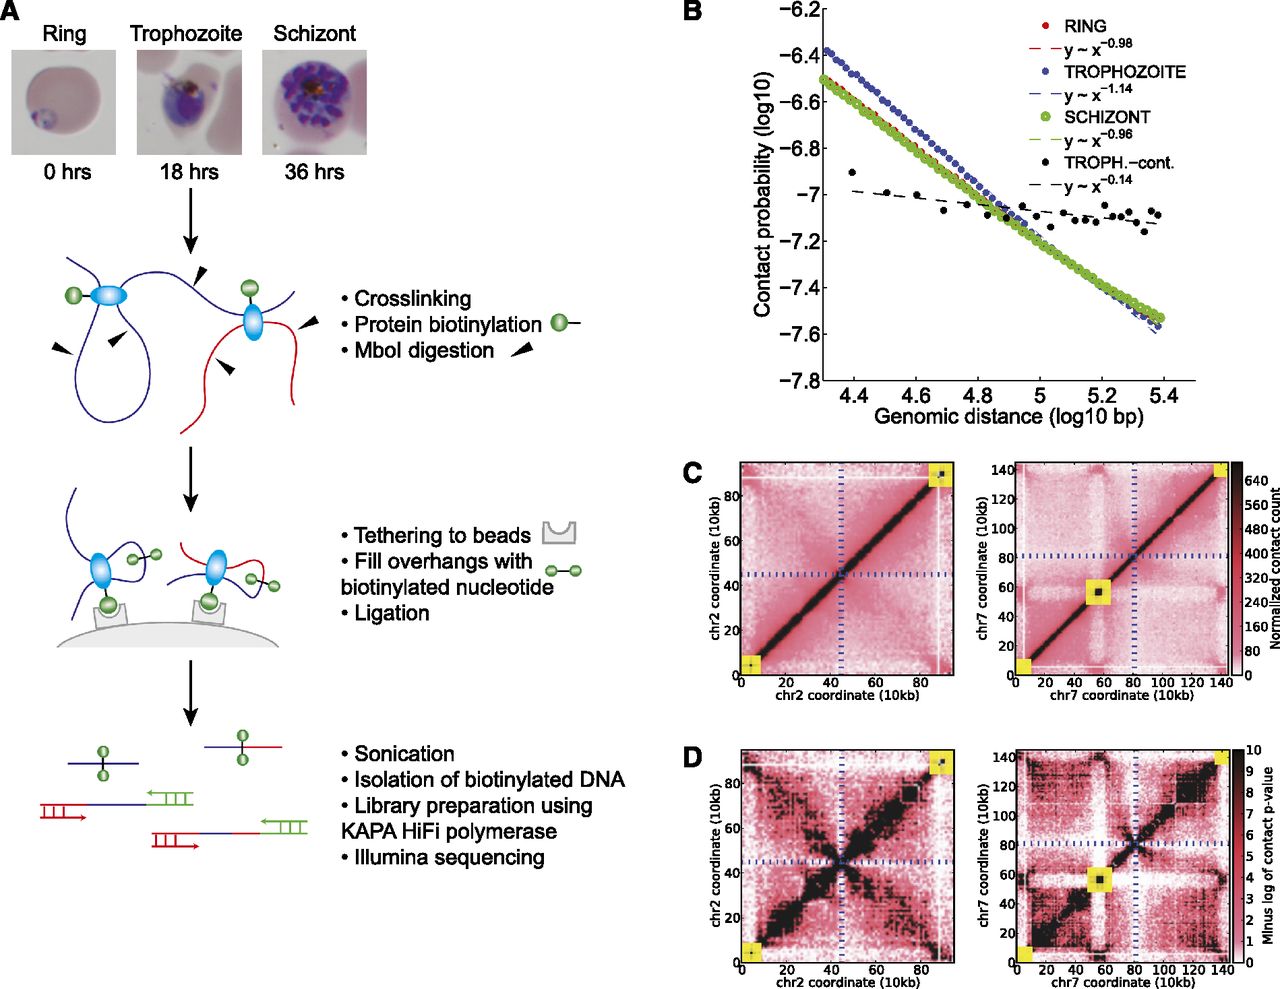
Figure 1.
Tethered conformation capture of the Plasmodium falciparum genome. (A) Experimental protocol. (B) Contact probability as a function of genomic distance, with log-linear fits for the three erythrocytic stages, as well as an experimental control. (C) Normalized contact count matrices at 10-kb resolution for chromosome 2 and chromosome 7 in the schizont stage. (D) Contact P-values (negative log10 scale) for chromosome 2 and chromosome 7 in the schizont stage. In C and D, yellow boxes denote clusters of VRSM genes, and blue dashed lines indicate the centromere location.


