
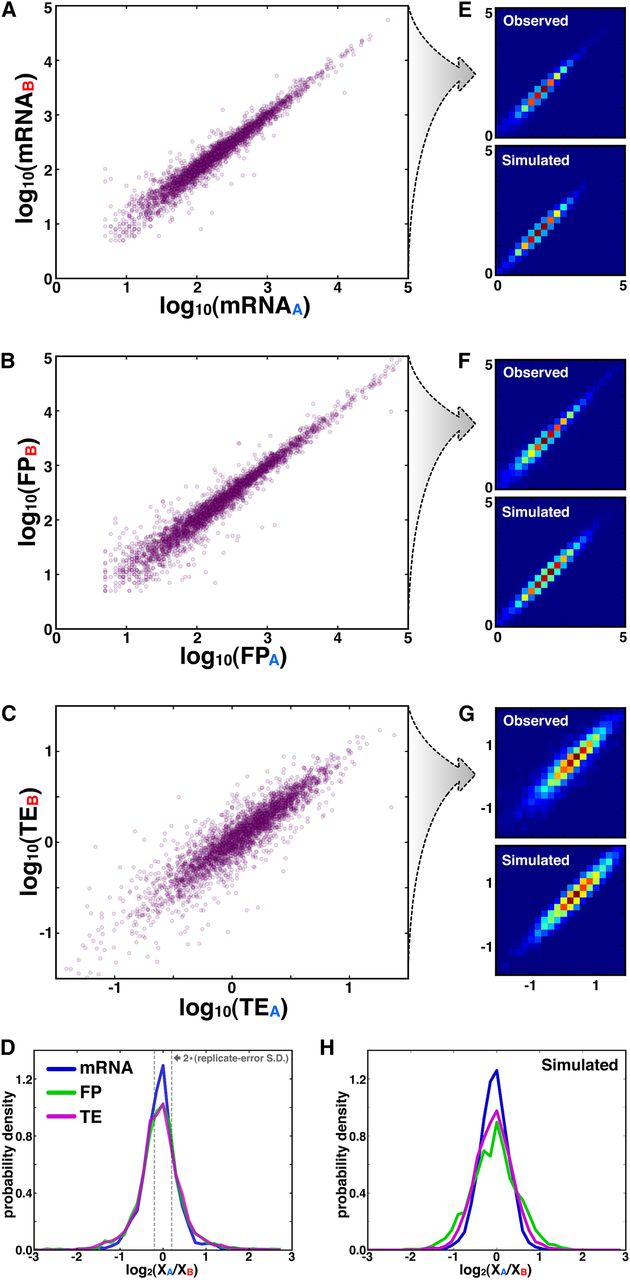
Figure 3.
ASE at translational level is as strong as at transcriptional level. (A–C) Scatterplots of the respective allelic levels of mRNA (A), FP (B), and TE (C). (D) Histograms of mRNAALFD, FPALFD, and TEALFD, where gray dotted lines indicate the two-standard-deviation boundary of error distributions from biological replicates (Supplemental Fig. S1). (E–G) Top panels show 2D heatmap PDFs of observed data from A–C, and bottom panels depict predicted data from simulation; cool and warm colors indicate lowly and highly populated bins, respectively. (H) Simulated data in E–G was used to plot histograms of mRNAALFD, FPALFD, and TEALFD.


