
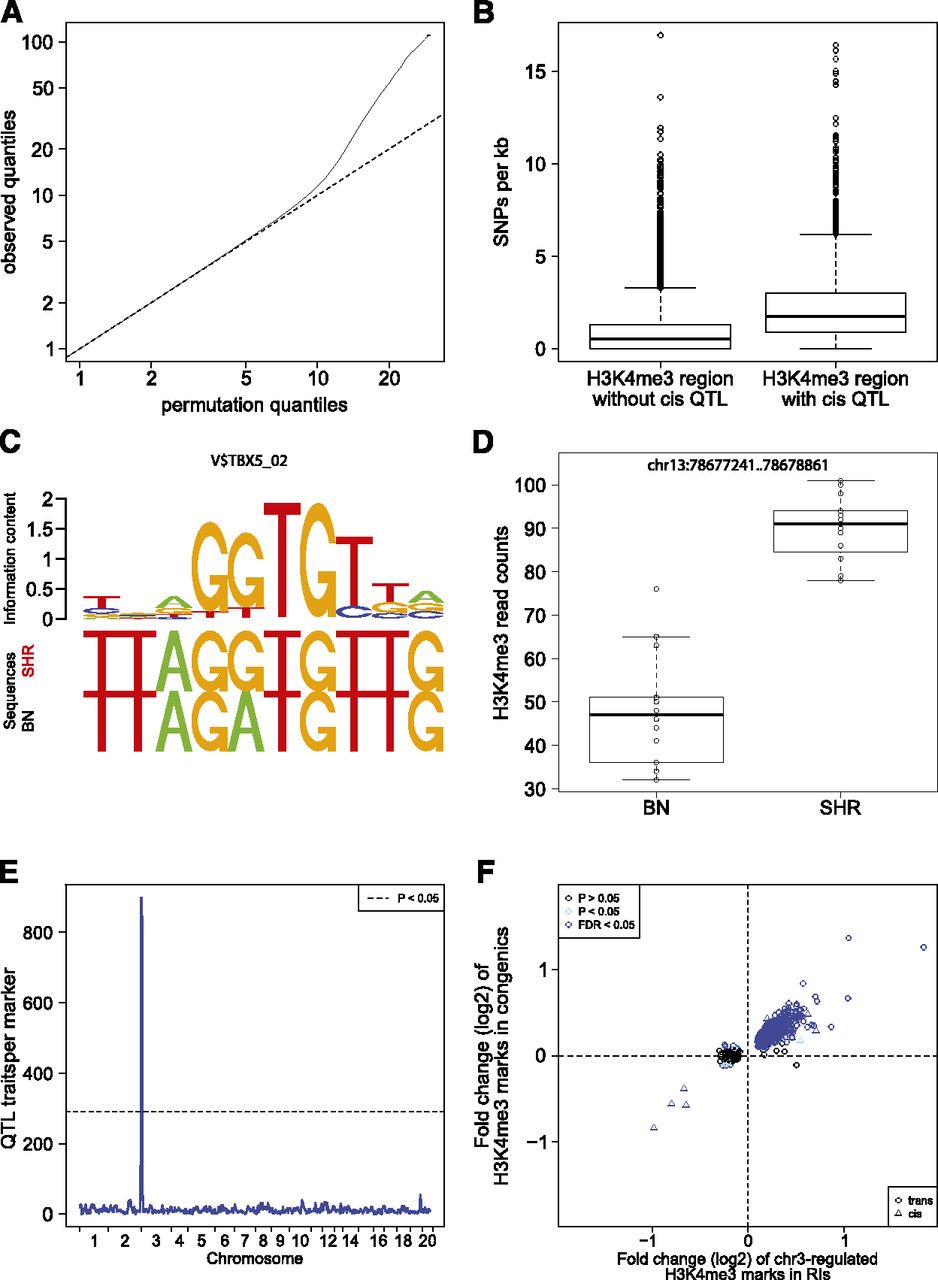
QTL mapping of histone modifications. (A) Quantile-quantile plots for the QTL analyses of histone modification traits. For each trait and each tissue, we show the observed quantiles of the association statistic plotted against the quantiles of the permutation-based null distribution. The traits are occupancy levels of H3K4me3 regions defined by the peak calling analysis (MACS), as well as H3K4me3 and H3K27me3 regions defined by annotations of known protein coding genes (Ensembl). (B) Boxplot of SNP frequency in H3K4me3 regions with cisQTLs compared with all regions. (C) Example of an altered TF-binding site between BN and SHR rats and its binding motif. (D) Boxplot of differential H3K4me3 modification at the same locus. (E) Genomic distribution of all identified QTLs is shown for H3K4me3 modification in heart tissue. One large QTL hotspot was identified at chromosome 3 regulating 899 histone marks. (F) Overlap of chr3-regulated H3K4me3 histoneQTLs and differentially regulated histone marks between SHR.BN-chr3 congenic and SHR control rats. The x-axis shows the logarithmic fold change of H3K4me3 marks with QTL (BN/SHR). The y-axis shows the logarithmic fold change of the same H3K4me3 marks in SHR.BN-chr3 rats compared with SHR controls. (Blue dots) Trans-regulated QTLs that have been validated using SHR and SHR.BN-chr3 congenic rats. (Blue triangles) Validated cis-regulated QTLs in the chr3 hotspot.


