
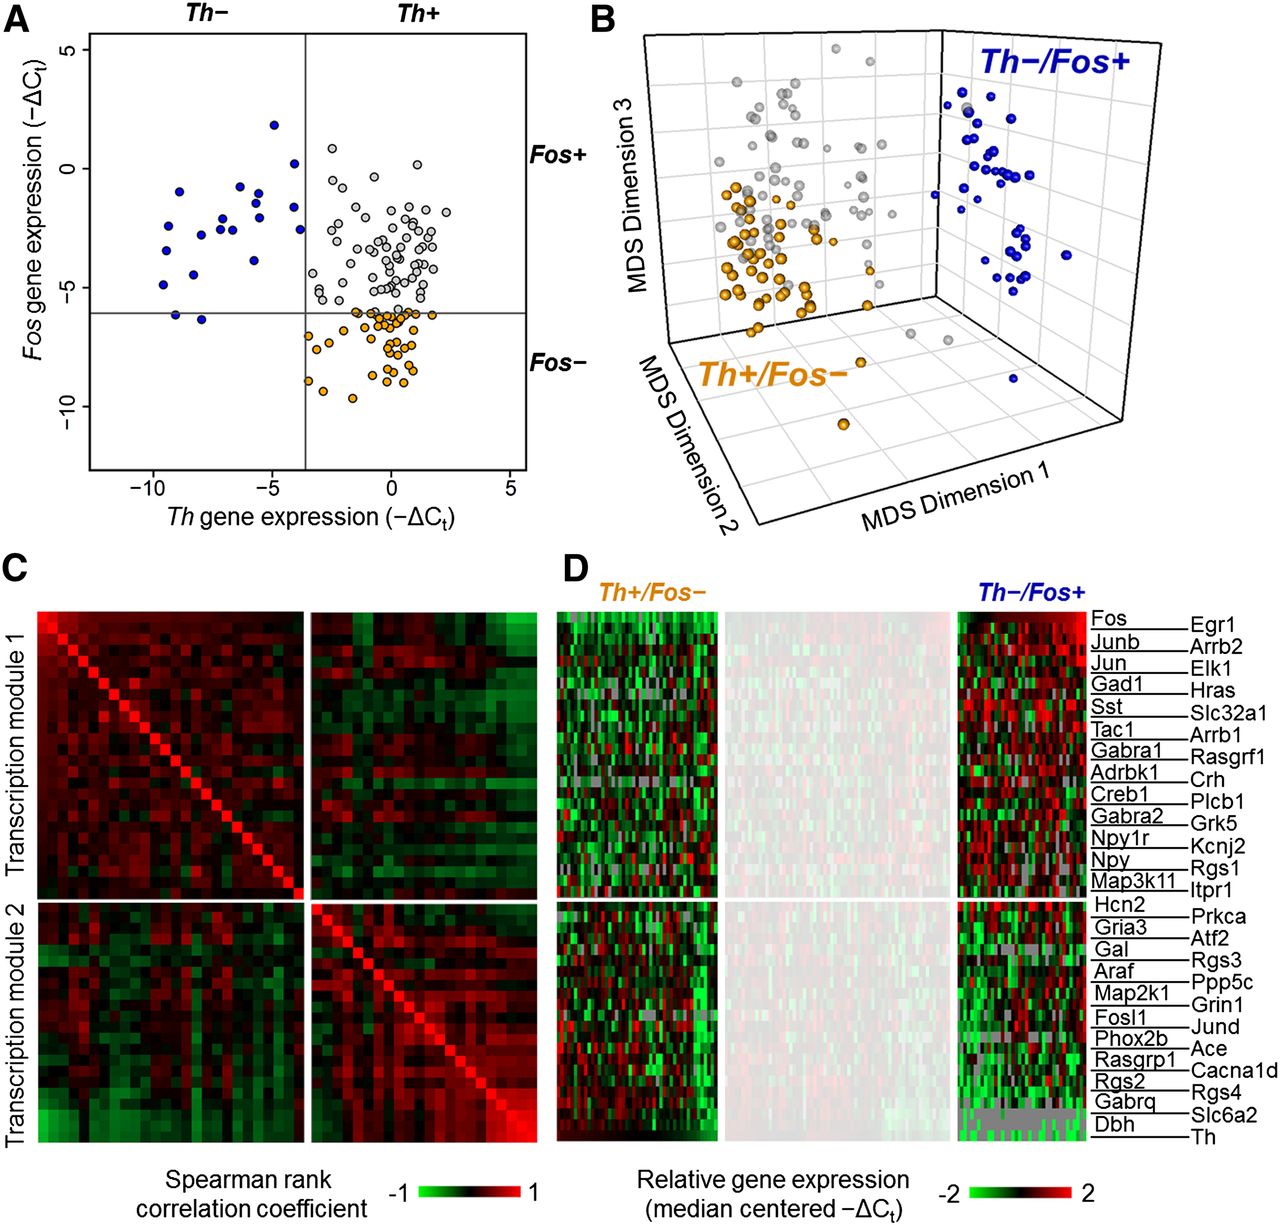
Input-driven extreme phenotypes. (A) Input-based cell type identification. A bivariate plot of single cells obtained from hypertensive rats based on their normalized expression of Th and Fos. The extremes of the distributions for each gene were initially explored, resulting in two extreme classes of single cells: (1) cells with no Th expression and (2) cells with no Fos expression. The gray lines indicate the threshold criteria used to define the extreme subtypes Th−/Fos+ (blue filled circles) and Th+/Fos− (orange filled circles). The effect of various thresholds used for classifying extreme classes is shown in Supplemental Figures S8–S11. (B) Clustering of input-based cell types. Three-dimensional MDS projection of single cells with the extreme phenotype classifications applied. These projects are based on the similarity of single cells with respect to their ranked expression order of the 48 gene subset. Alternative viewing perspectives of the 3D MDS projections are included in Supplemental Figure S6A,C,E. (C) Gene expression correlation modules. Gene-to-gene pairwise Spearman rank correlation coefficients across the extreme subtype cells were calculated and are represented in the heat map. The highly variable genes show that the underlying gene expression in these extreme subtypes can be organized into two correlative groups, or transcription modules. These transcription modules group genes that show higher correlations (upper left quadrant and lower right quadrant of the heat map) with each other across single cells of the extreme subtypes. Columns and rows with the same index representing a particular gene follow the row annotation in panel D. (D) Gene expression gradients in input-based cell types. Heat map of normalized gene expression data. An overall gene expression gradient pattern can be observed in the gene expression profile of the 48 highly variable genes across the extreme subtypes. Focusing on the extreme regions to the left and right of the whited-out region on the heat map, opposite expression behaviors can be observed in the two transcription modules between the two extreme input-based subtypes. The upper set of genes in the heat map shows an overall decrease in gene expression in Th+/Fos− cells and an increase in Th−/Fos+ cells. The opposite behavior is observed in the lower set of genes. The expression patterns of these extreme subtypes occupy opposite ends of the gene expression gradient observed.


