
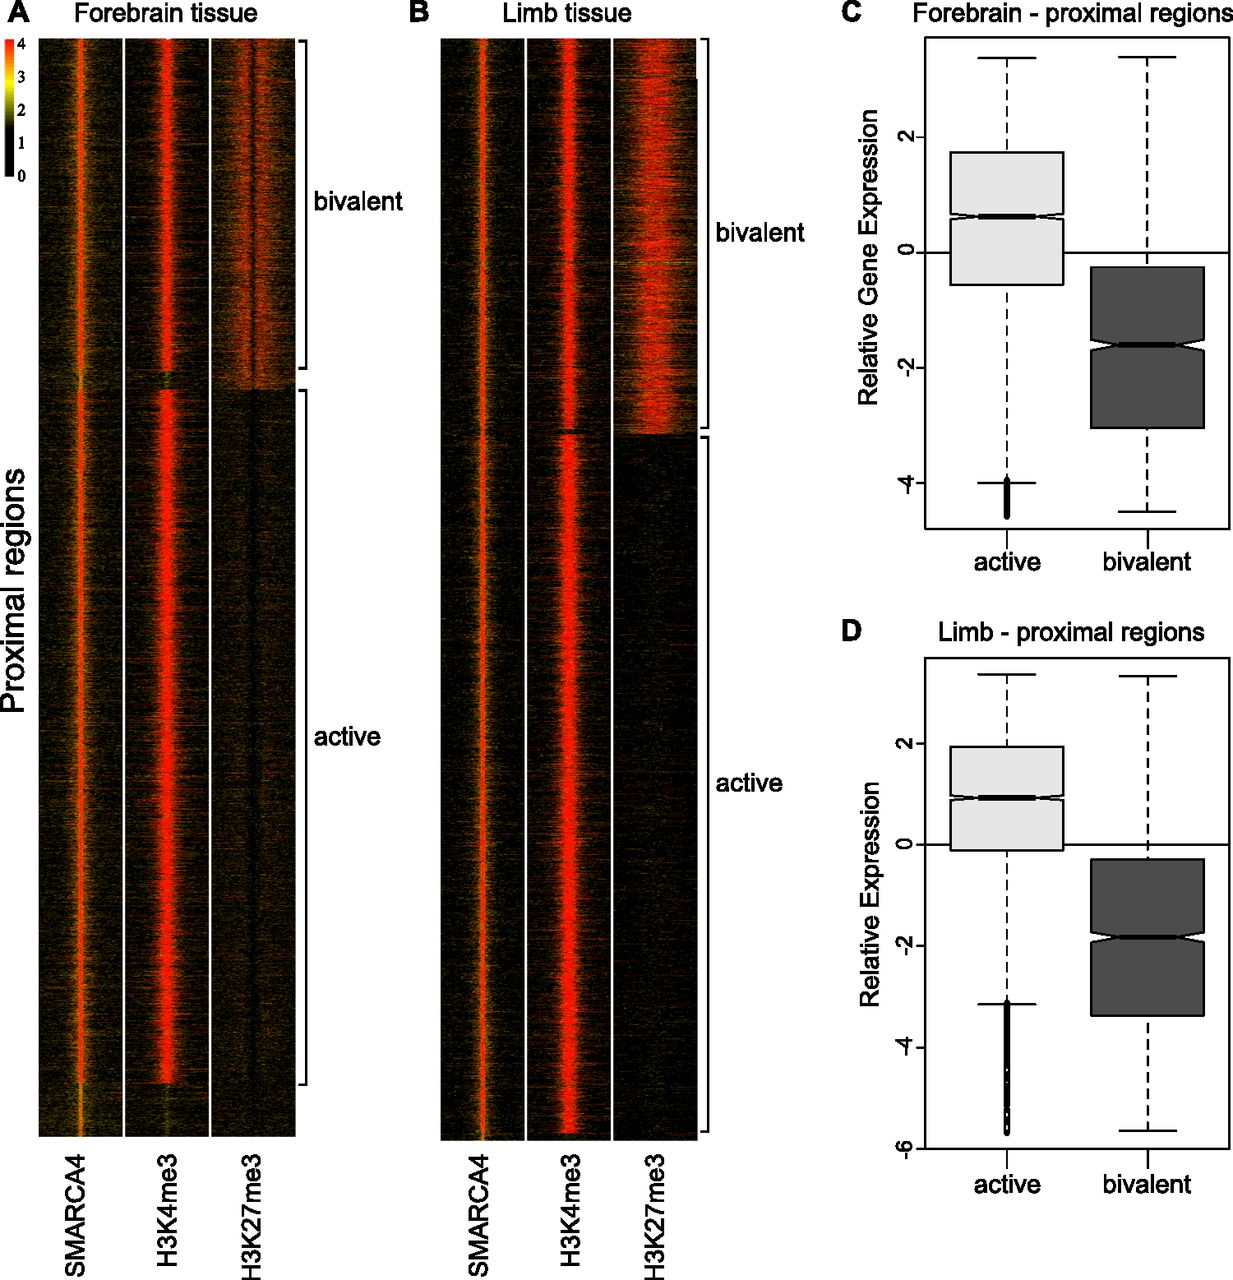
Proximal SMARCA4 enrichment is associated with active and bivalent promoters. (A,B) Heatmaps displaying coverage for SMARCA4 and informative histone marks (H3K4me3 and H3K27me3) for proximal regions. Each row of heatmap represents one enhancer, with coverage plotted across the 10 kb surrounding enrichment peak. SMARCA4 enrichment at proximal regions for forebrain (n = 10,737) (A) and limb (n = 10,193) (B). (C,D) Gene expression profile associated with SMARCA4 proximal regions classified as active or bivalent. RNA-seq data were generated for E11.5 forebrain and limb and the distribution of expression levels of the nearest gene was compared for SMARCA4-enriched regions in forebrain (C) and limb (D).


