
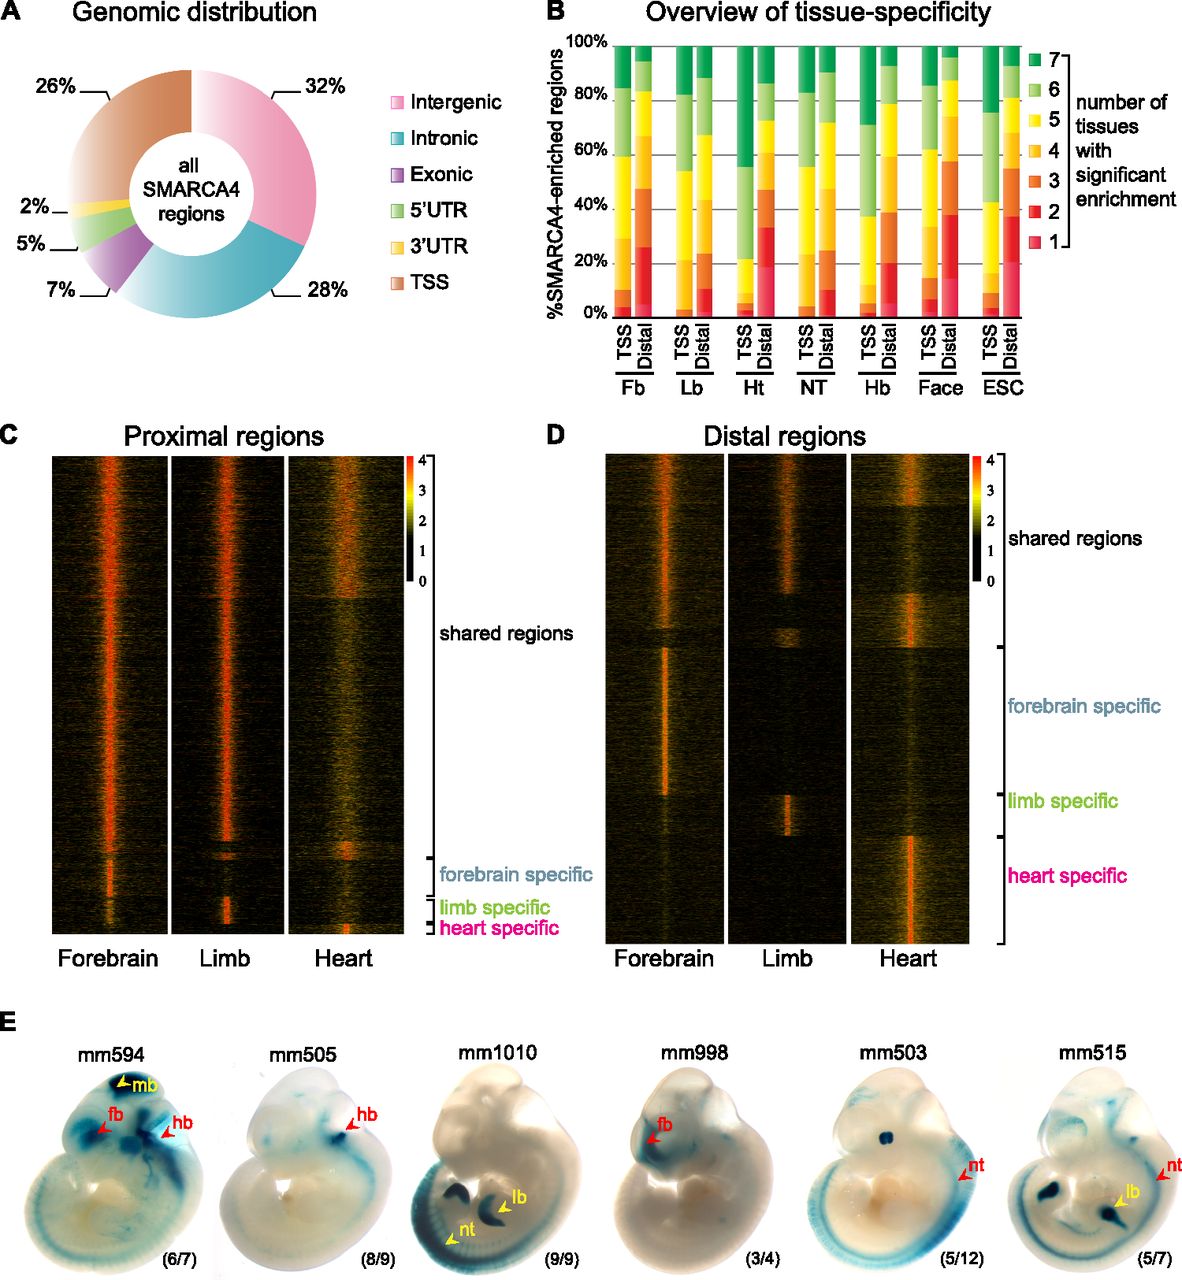
ChIP-seq identifies SMARCA4-enriched regions genome-wide. (A) Genomic distribution of SMARCA4-enriched regions. (B) Tissue-specific SMARCA4 enrichment in TSS versus distal regions in each data set. The bar graph illustrates the lower percentage of tissue-specific SMARCA4-bound regions among the proximal sites (TSS) versus distal sites by indicating the number of tissues in which a specific SMARCA4 region is significantly enriched (red, present in one tissue; dark green, present in seven tissues). (C,D) Heatmaps displaying SMARCA4 coverage across three tissues (forebrain, limb, and heart). Each row of heatmap represents one enhancer, with coverage plotted across the 10 kb surrounding enrichment peak. (C) SMARCA4 enrichment proximal to TSSs. (D) SMARCA4 enrichment at distal regions. (E) Selection of six reproducible SMARCA4-bound enhancers at E11.5, illustrating SMARCA4 activity across different tissues. Reproducible predicted patterns are indicated by red arrows while unpredicted reproducible tissue-specific activity is indicated by yellow arrows. (Fb) Forebrain; (Mb) midbrain; (Hb) hindbrain; (Nt) neural-tube; (Lb) limbs; (Ht) heart. The reproducibility of the indicated patterns is indicated for each embryo (number of observed/total number of embryos).


