
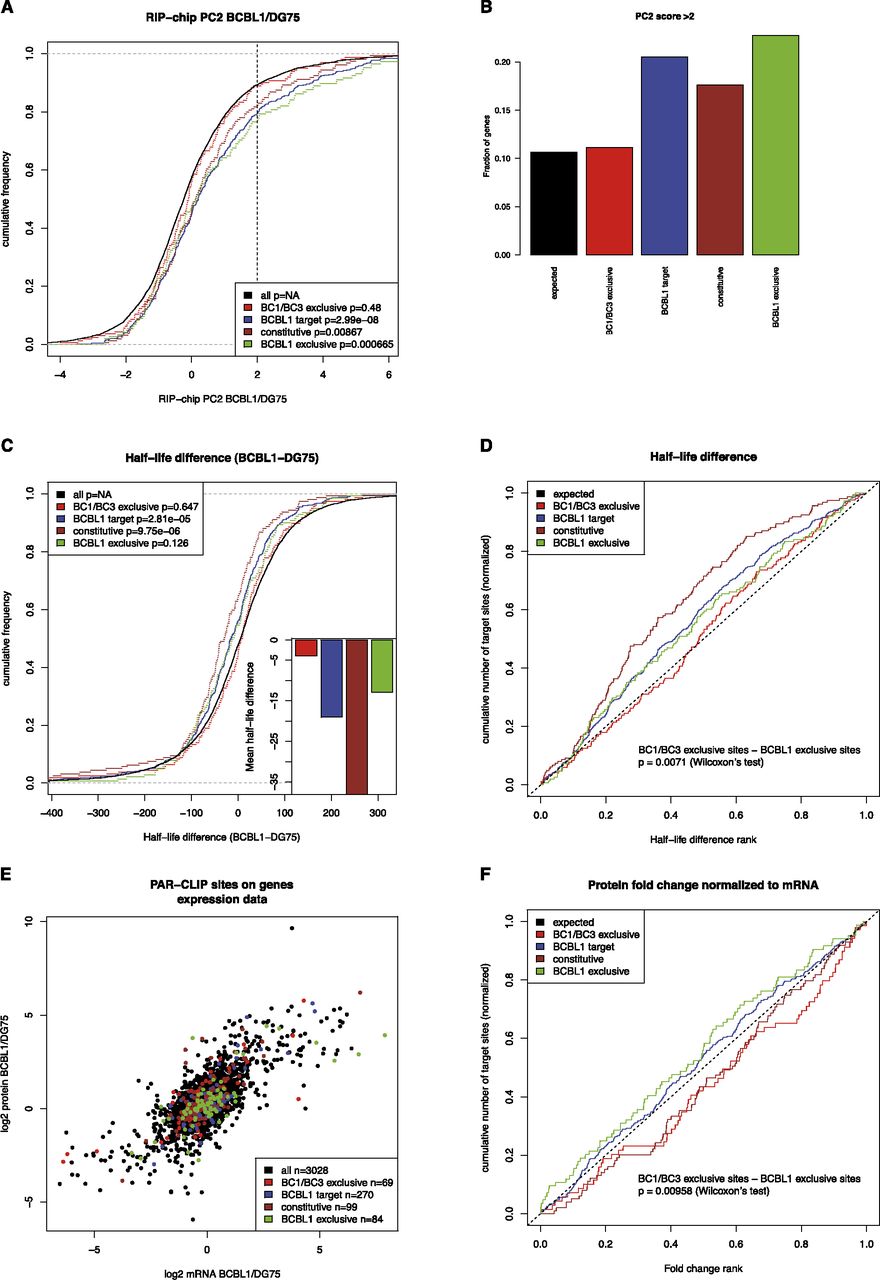
PAR-CLIP targets in RIP-chip experiments, mRNA half-life measurements, and expression measurements. (A) Differential RIP-chip enrichment scores (PC2 scores; positive values indicate higher enrichment in BCBL1 than in DG75). Generally, KSHV microRNA targets active in BCBL1 are significantly shifted toward higher values as compared to all other genes with any PAR-CLIP target site, in contrast to KSHV target sites exclusively active in BC1 or BC3 and not in BCBL1. B illustrates this further: The enrichment of genes with any KSHV site, with a constitutive or a BCBL1 exclusive site over genes with BC1/BC3 exclusive sites among all genes with PC2 score > 2 is about twofold in all cases. (C) Distributions of half-life differences between BCBL1 and DG75 for all genes with PAR-CLIP target sites. Thus, positive values indicate a longer mRNA half-life in BCBL1 than in DG75. Genes with KSHV microRNA targets active in BCBL1 tend to have shorter half-lives in BCBL1 than in DG75. This is highly significant for all BCBL1 target genes as well as the constitutive targets but not for BCBL1-specific targets, even if their half-life is on average ∼20 min shorter in BCBL1 than in DG75. However, KSHV microRNA targets that are inactive in BCBL1 do not show any shift in their half-lives. (D) The difference between targets active exclusively in BCBL1 is statistically significantly different from targets active exclusively in BC1 or BC3, when their ranks among all PAR-CLIP targets are considered. (E) Genes are scattered according to their mRNA log2 fold changes between BCBL1 and DG75 on the x-axis and to their protein log2 fold changes on the y-axis. In both dimensions, none of the KSHV target sets is significantly down-regulated on either the mRNA or protein level (Supplemental Fig. S5). However, target sites active in BCBL1 appear to be shifted toward the bottom right. These sites correspond to genes whose protein level fold change between BCBL1 and DG75 is lower than expected from the mRNA level. (F) The ranks of protein fold changes normalized to their mRNA levels for all gene sets considered. Normalized protein fold changes are significantly lower for genes with BCBL1-specific target sites than for genes with target sites inactive in BCBL1 (P < 0.01, Wilcoxon rank sum test) (see also Supplemental Fig. S3).


