
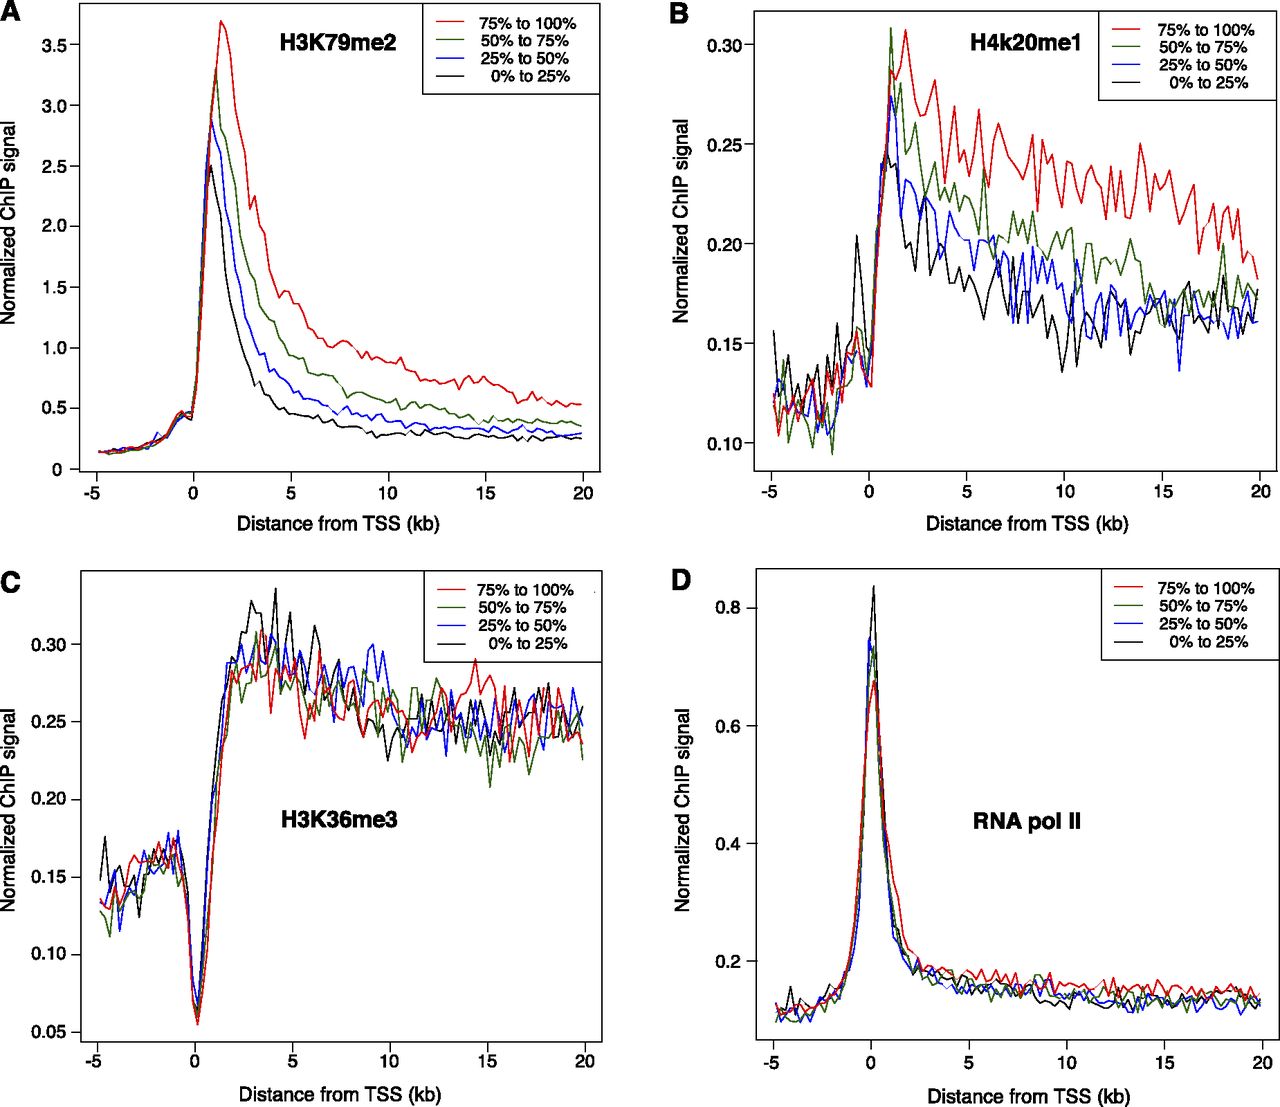
Elongation rates are associated with specific histone modifications. Genes expressed in K562 cells were ranked according to elongation rate and placed into four equal-sized groups (from fastest to slowest: red, green, blue, black). ChIP-seq data for K562 cells were obtained from ENCODE, and median binned values for each group were plotted as indicated for H3K79me2 (A), H4K20me1 (B), H3K36me3 (C), and RNA polymerase II (D). In A and B, genes with faster elongation rates have a higher density of histone modification both near the transcription start site (TSS) and within the gene bodies. In C and D, neither histone modification nor RNA polymerase II occupancy correlated to transcription elongating rates.


