
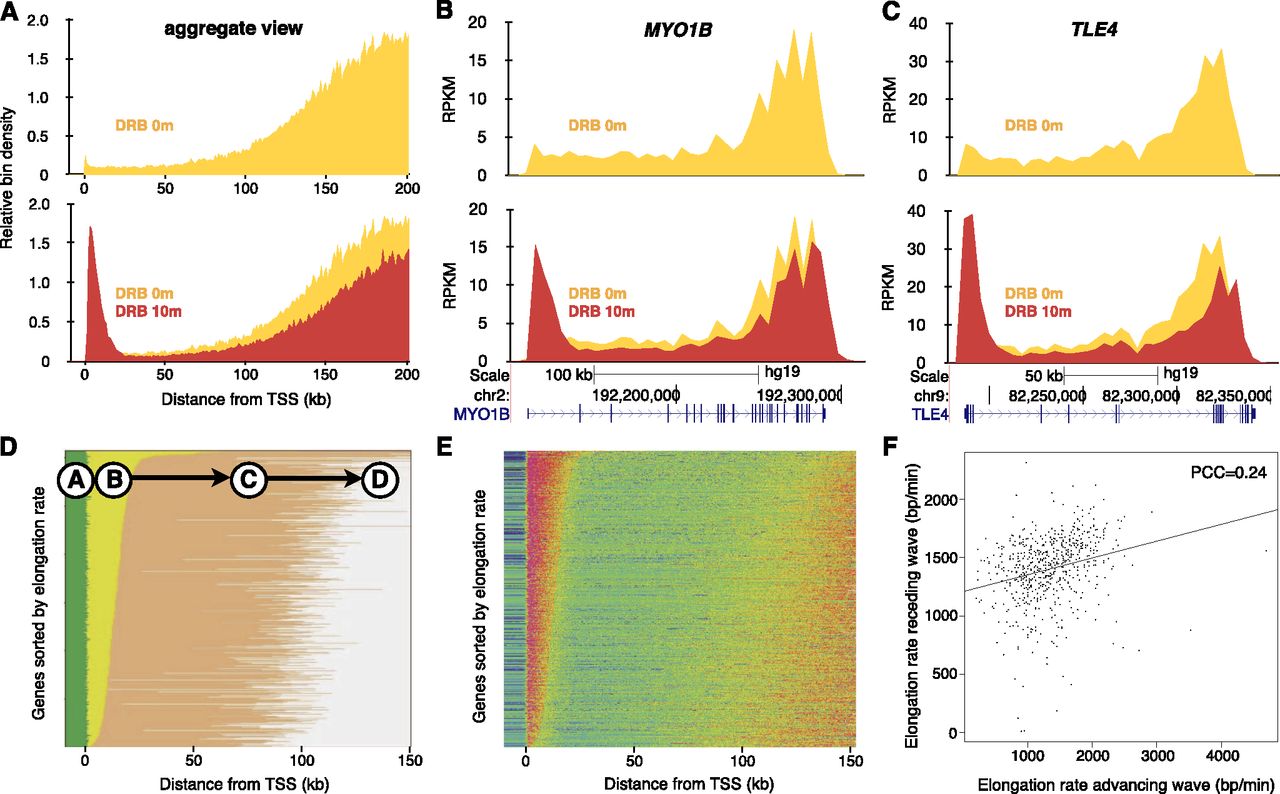
The relationship between advancing and receding transcription elongation waves. (A) Aggregate view of 189 genes longer than 200 kb in HF1 cells during DRB treatment (yellow) or following a 10-min recovery period after DRB treatment (red). Advancing and receding transcription waves in the large genes MYO1B (B) and TLE4 (C). (D) A four-state hidden Markov model was developed to take into account this receding wave in large genes. Genes in HF1 cells were ordered by the length of the advancing wave (state B) and pseudocolored by state (green, A; yellow, B; orange, C; gray, D). (E) Normalized signaling for genes ordered according to the length of state B. (F) The relationship between elongation rates calculated by the length of the advancing wave (state B) and the distance of the trough between the end of the advancing wave and the beginning of the receding wave (state C). (PCC) Pearson’s correlation coefficient.


