
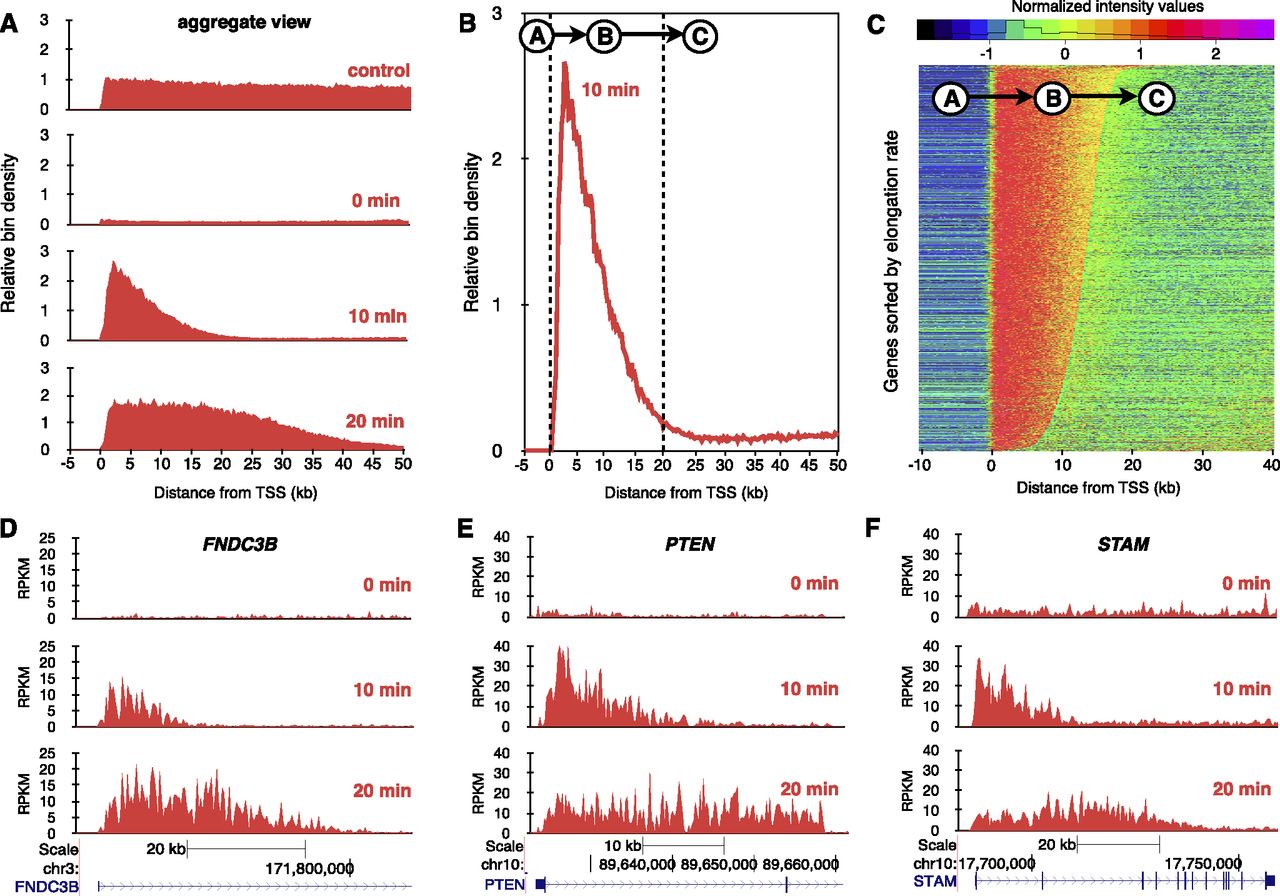
Transcription elongation rates measured genome-wide using BruDRB-seq. (A) Aggregate view of nascent RNA reads through the first 50 kb of large expressed genes in the human fibroblast cell line HF1. (Control) Bru labeling for 30 min. (0 min) Bru labeling during the last 10 min of a 60-min DRB treatment. (10 min) Appearance of a nascent transcription wave at the 5′ end of genes during a 10-min recovery after DRB removal (10-min Bru labeling during recovery period). (20 min) Advancing nascent transcription wave after a 20-min recovery time following DRB removal (Bru labeling during last 10 min of recovery). (B) Aggregate view of BruDRB-seq (10-min recovery) showing the upstream region of TSS having a low signal (A), advancing wave (B), and region downstream from the advancing wave with low signal (C). (C) A hidden Markov model was developed to identify advancing waves and measure their lengths, which are proportional to their elongation rates, having A, B, and C represent the three states of this model. Normalized signals of genes in HF1 cells ordered by elongation rate for a 10-min recovery following DRB removal are shown. Examples of transcriptional recovery in individual genes after 0-, 10-, and 20-min recovery after DRB removal in HF1 cells are shown in (D), (E), and (F).


