
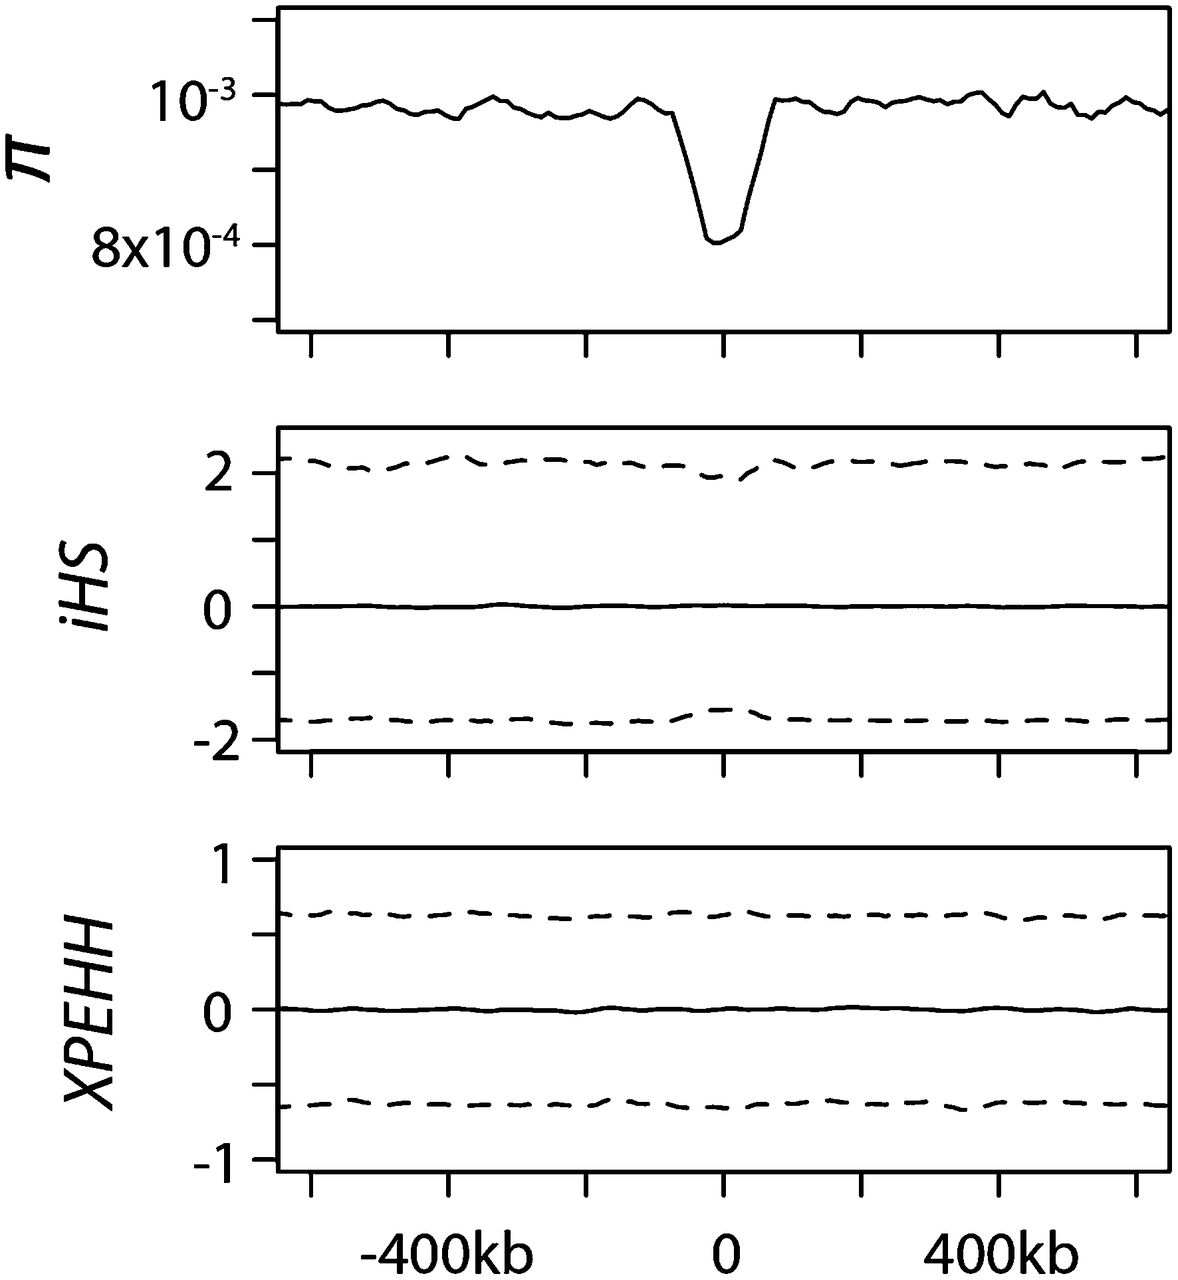
Figure 4.
Robustness of iHS and XPEHH to BGS. We tested the effect of BGS on iHS and XPEHH (Results; Supplemental Material). (Top) Average heterozygosity; (middle) iHS; (bottom) XPEHH. The full lines represent average iHS or XPEHH along the simulated region. The dashed lines represent the limits of iHS or XPEHH 95% confidence intervals.


