
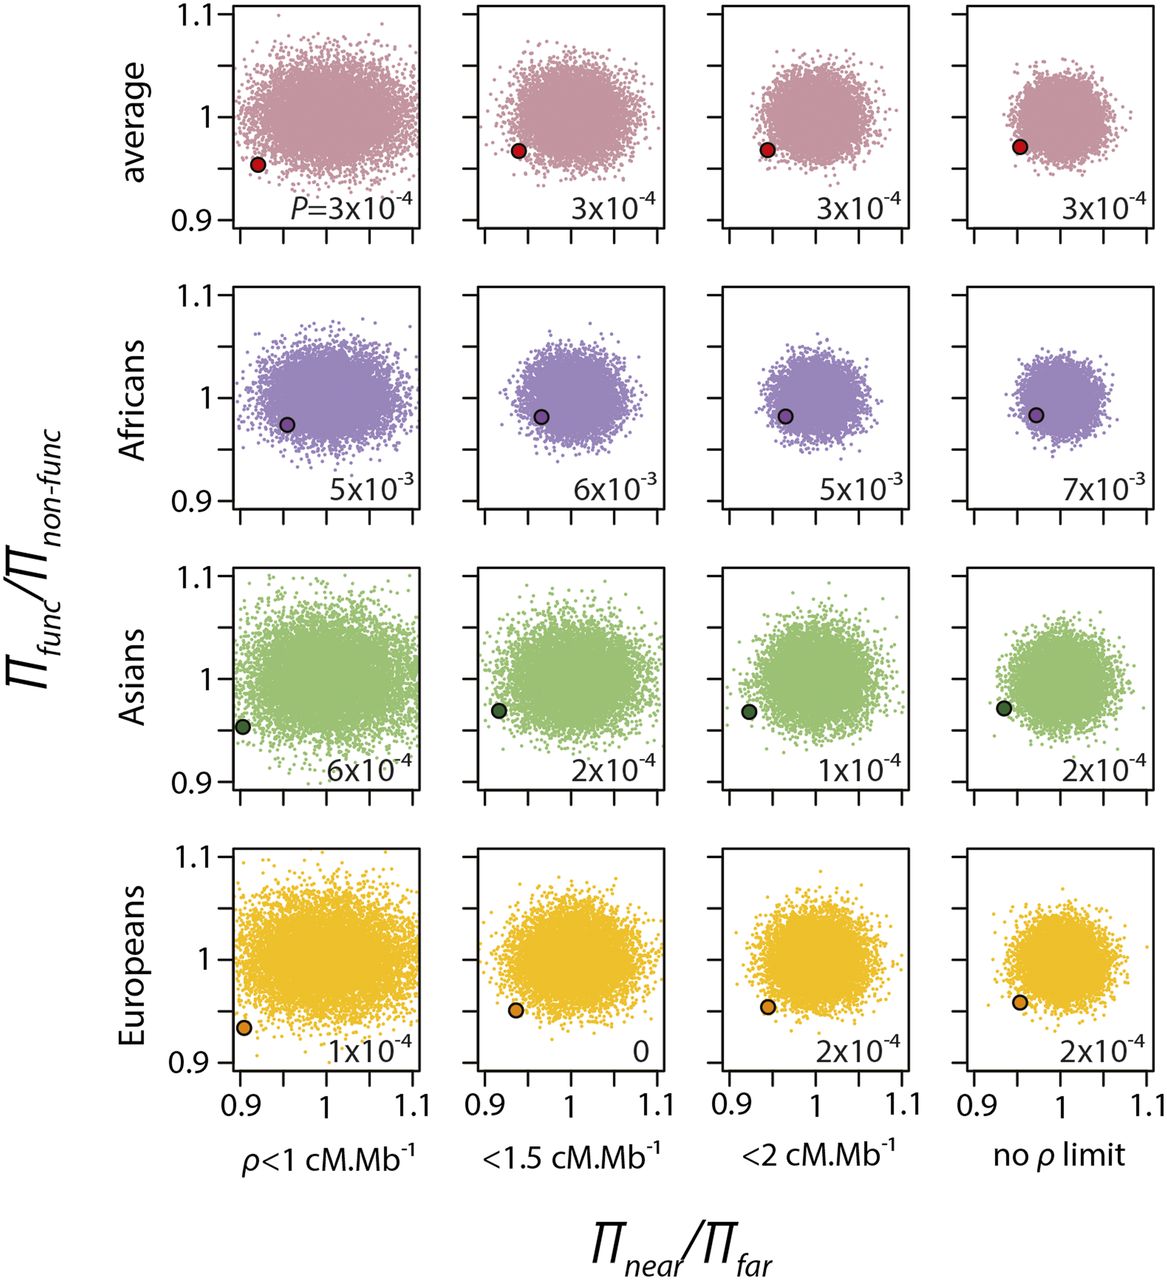
Figure 3.
Combined near-vs-far and functional-vs-nonfunctional tests. Clouds of small dots represent the ratios πnear/πfar and πfunc/πnon-func obtained with the randomization test. The larger dot in each graph represents the observed πnear/πfar and πfunc/πnon-func. The numerical values at the lower right of each graph are the P-values obtained after 10,000 iterations of the randomization test. The P-values are estimated as the proportion of the randomizations that give values below the observed value in both tests.


