
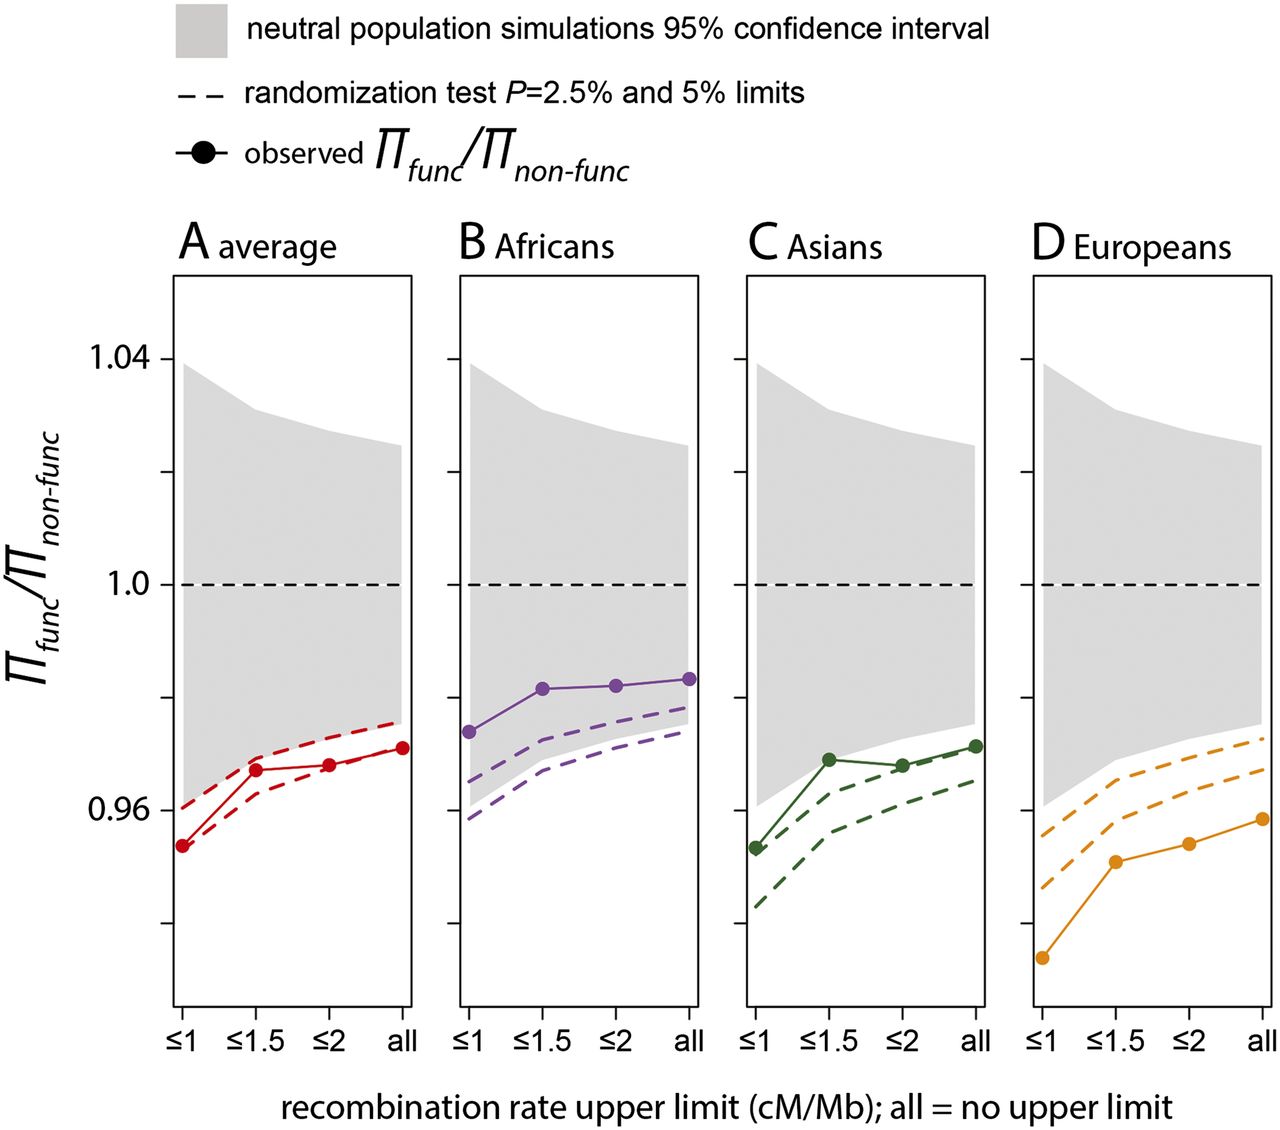
Lower diversity near functional amino acid substitutions. We compared heterozygosity near functional amino acid changes, πfunc, with heterozygosity near nonfunctional amino acid changes, πnon-func. πfunc is the average over all functional windows from the bootstrap procedure (Methods). πnon-func is the average over all nonfunctional windows. The gray area depicts the 95% confidence intervals based on the neutral simulations (Methods). The dashed lines show 95% and 97.5% confidence intervals established based on a randomization test (Methods). On the x-axis, ≤1, ≤1.5, etc., means that we use only windows with recombination rates ≤1 cM/Mb, 1.5 cM/Mb, etc., to compare diversity near and far from functional amino acid substitutions. (All) All windows are used independently of their recombination rates.


