
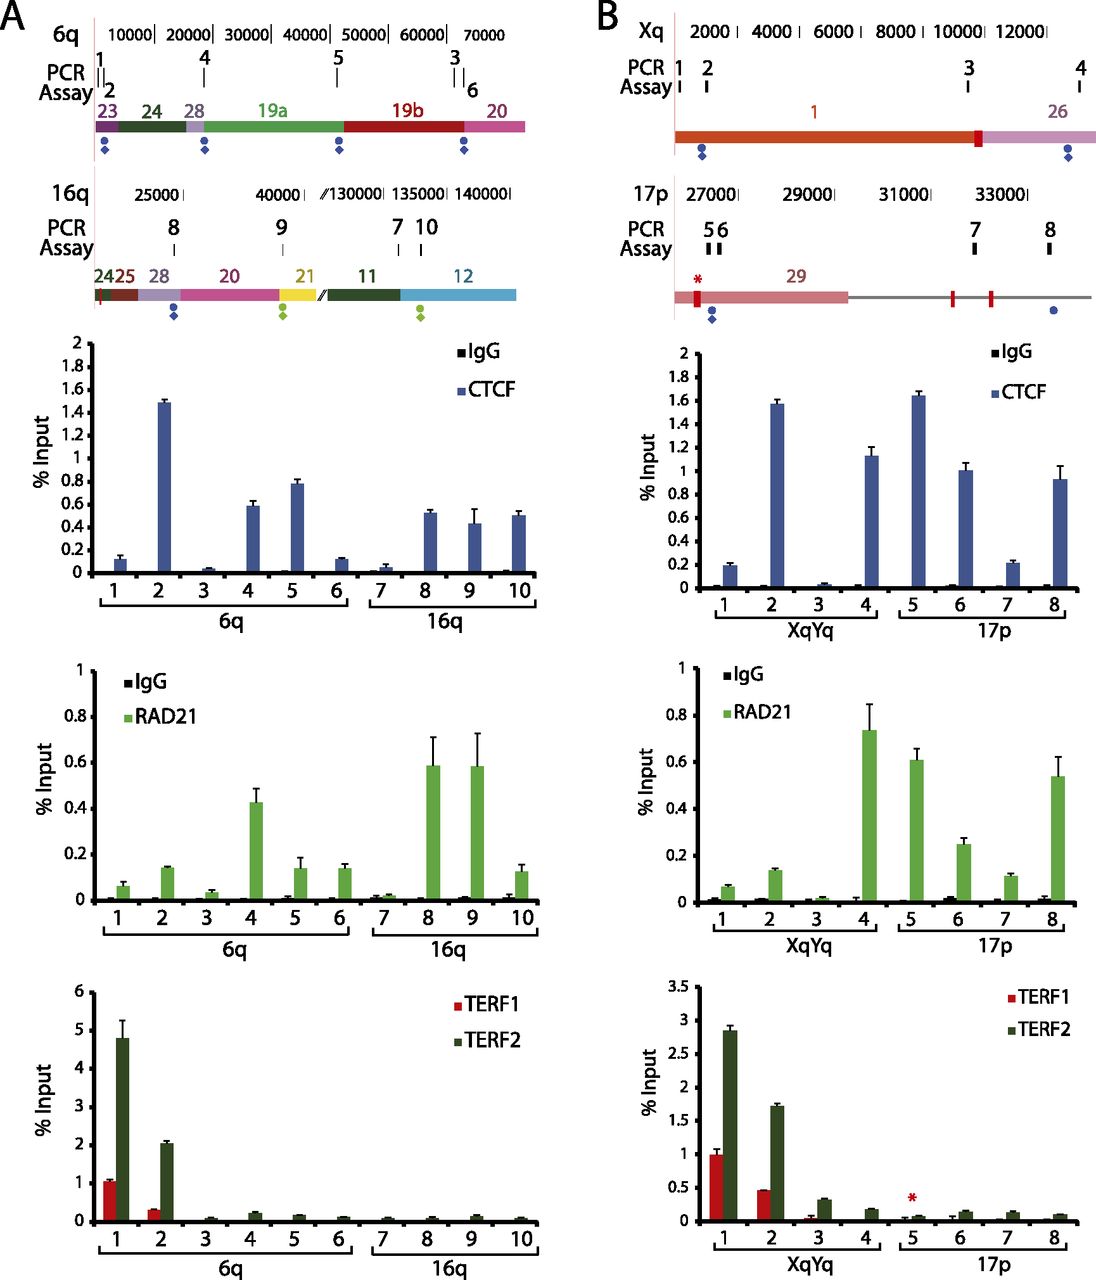
ChIP-qPCR analysis of subtelomeric DNA protein binding sites predicted by ChIP-seq data set mappings. Candidate sites of CTCF, cohesin, TERF1, and TERF2 binding were analyzed by ChIP-qPCR. Segments of the 6q and 16q (A) and the Xq and 17p (B) subtelomeres are shown, with the coordinates (in bp) shown at the top and the subtelomere paralogy regions indicated on the respective segments. The positions of ITSs are indicated by red rectangles extending from the segments; an ITS with called TERF1 and TERF2 ChIP-seq enrichment peaks is marked with a red asterisk. The positions of colocalized CTCF and cohesin (RAD21) peaks called in LCLs are shown as green dots (if not called in other cell types) and as blue dots (if also called in ES and/or IMR90 cells). A diamond beneath a dot indicates a site where no ChIP-seq peak was called when only uniquely mapping reads were considered. Numbered ticks show the positions of primer sets used in the ChIP-qPCR experiments, and correspond to the numbered ChIP-qPCR results shown for CTCF, RAD21, and TERF1 and TERF2 graphed as the percentage of input DNA. The bar graphs represent the average of percentage input (mean ± SD) for each ChIP from three independent ChIP experiments. Ticks numbered 1 and 2 are qPCR assays for DNA immediately adjacent to the telomere, used here as positive controls for TERF1 and TERF2 binding (primer positions 1 and 2) and a positive control for a previously validated subtelomeric CTCF/RAD21 colocalization site (primer position 2).


