
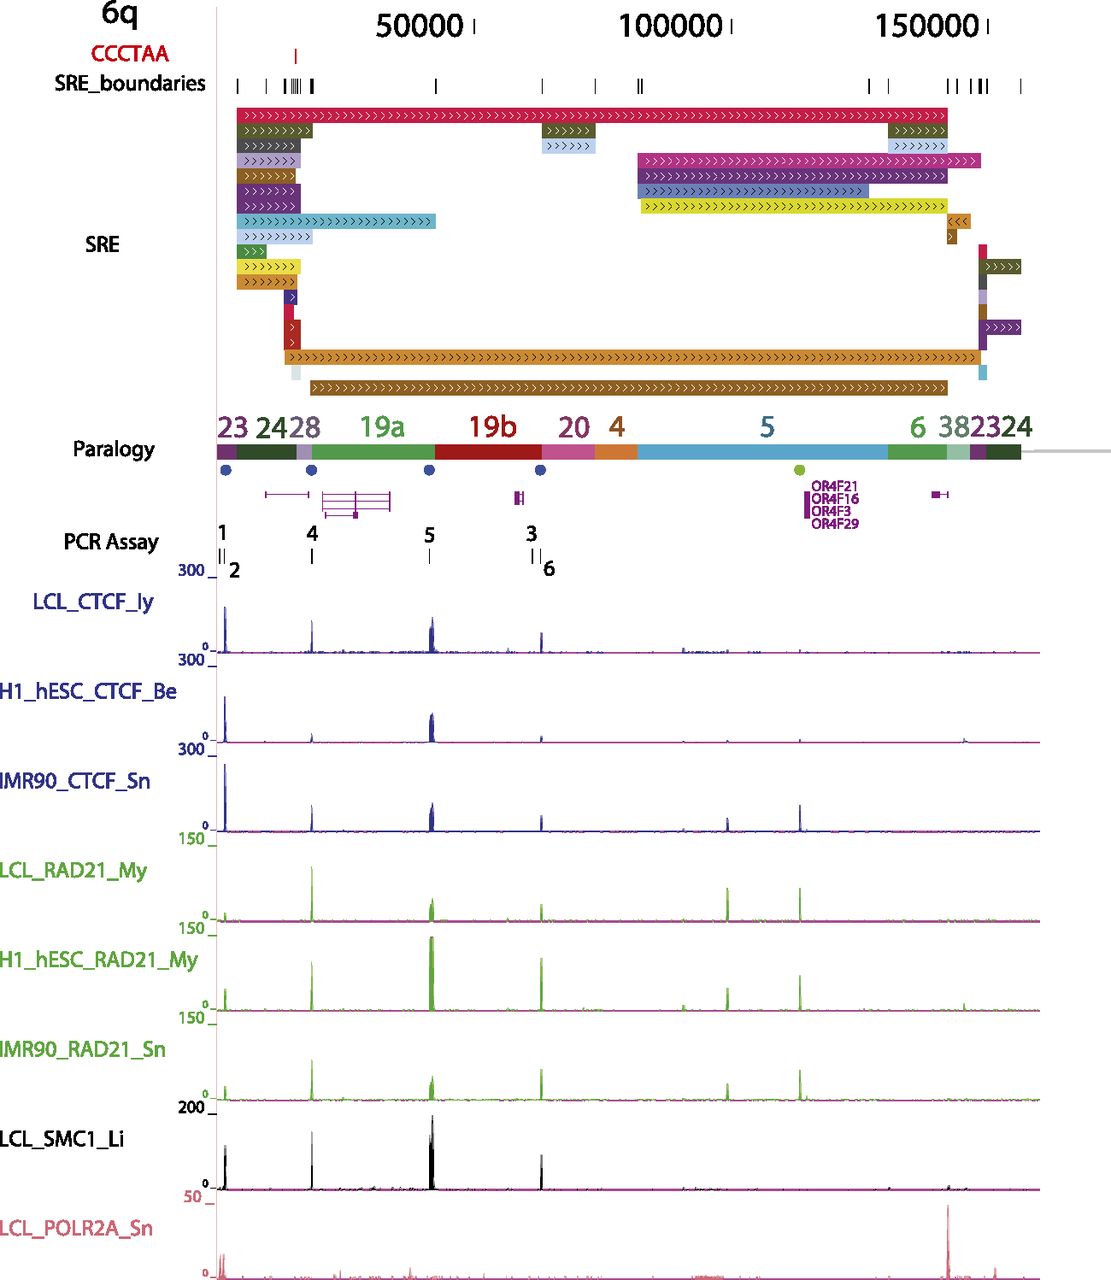
Figure 3.
Example of an annotated subtelomere with CTCF and cohesin binding enrichment peaks from multiple cell types. The first 160 kb of 6q is shown in our browser. The PCR assay track marks the primer sites used for ChIP-qPCR (see Fig. 4). In addition to the ChIP-seq data sets shown in Figure 2 for LCLs (Deng et al. 2012), enrichment profiles for CTCF and RAD21 are shown following mapping of the ENCODE Project ChIP-seq data sets from the pluripotent human embryonic stem cell line H1-hESC and the primary fibroblast cell line IMR90.


