
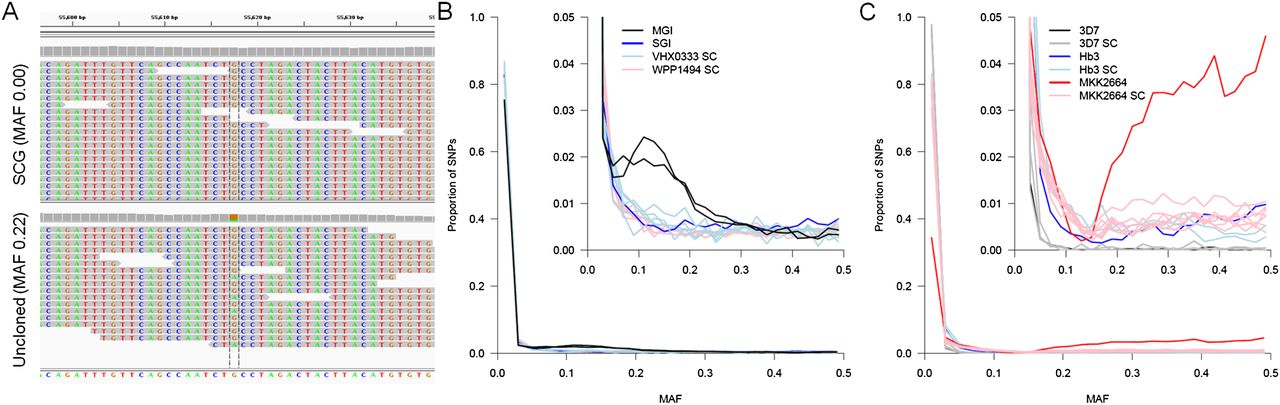
Purity of single-cell genome sequence data. SNPs with 30–250× read depth were used to estimate the purity of single-cell data. (A) At variant sites we expect to detect both alleles in deep-sequence data from an uncloned infection (bottom) while these sites should be invariant in single-cell sequence (top). The within-host minor allele frequency (MAF) was estimated from all Q30 SNPs after exclusion of regions of the genome with known high error rates (i.e., vir/var gene clusters and nonexonic regions for P. falciparum). (B) Genome sequencing from single P. vivax cells shows a similar distribution of mixed sites to a putatively single clone infection (SGI; VHX0333). Genome sequence from an MGI (VHX059) is shown to highlight the clear difference from clonal lines. (C) Genome sequencing from single P. falciparum cells from both mixture experiments and a genuine infection (MKK2664) shows a similar proportion of sites showing multiple alleles as other putatively clonal genome sequences. For comparison, genome sequence from the Hb3 and 3D7 laboratory lines used in mixture experiments are shown.


