
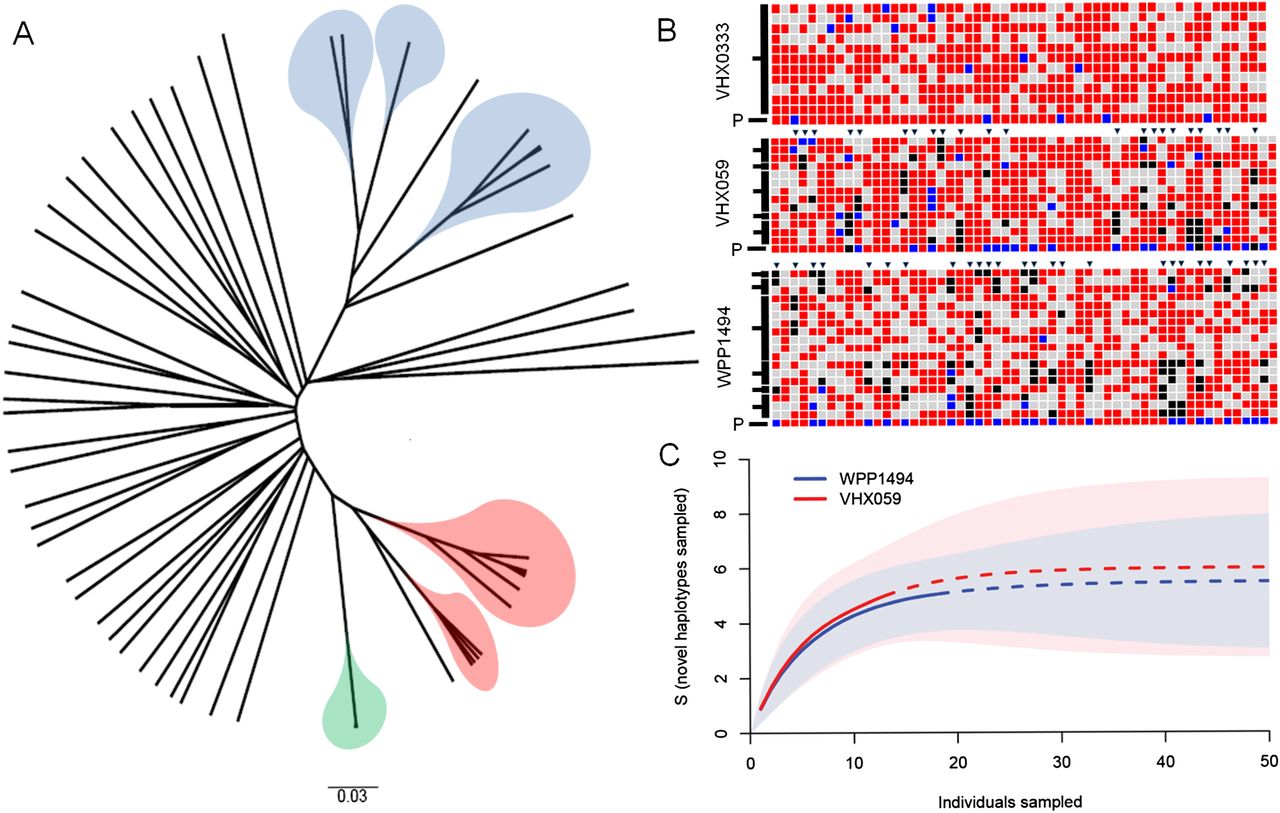
Application of SCG to P. vivax infections. (A) UPGMA tree of pairwise allele sharing of P. vivax infections on the Thai-Burmese border. Single-cell genotypes are highlighted (WPP1494: blue, VHX059: red, and VHX0333: green); all other branches are from putatively single-clone P. vivax infections. (B) Within-infection haplotypes from single-cell genotypes. Single-cell genotypes are shown as rows and individual SNPs as columns. Major alleles are shown in red, minor alleles in black, mixed calls are in blue, and missing data in gray. Uncloned infection genotypes are shown by a P and polymorphic markers by triangles. For clarity, only VeraCode SNPs called by >40% of single cells are shown. Haplotypes (black bars on the left) are defined by single-cell genotypes that differ by <5% of SNPs. These haplotype abundances were used as an input to rarefaction analysis, and curves were used to estimate how deeply infections were sampled (C). Mean values are shown by lines (where data has been extrapolated the line is dashed); 95% confidence limits are shown in light blue/pink corresponding to each line. For either infection there is little reward for sampling deeper than 40–50 single cells from an infection.


