
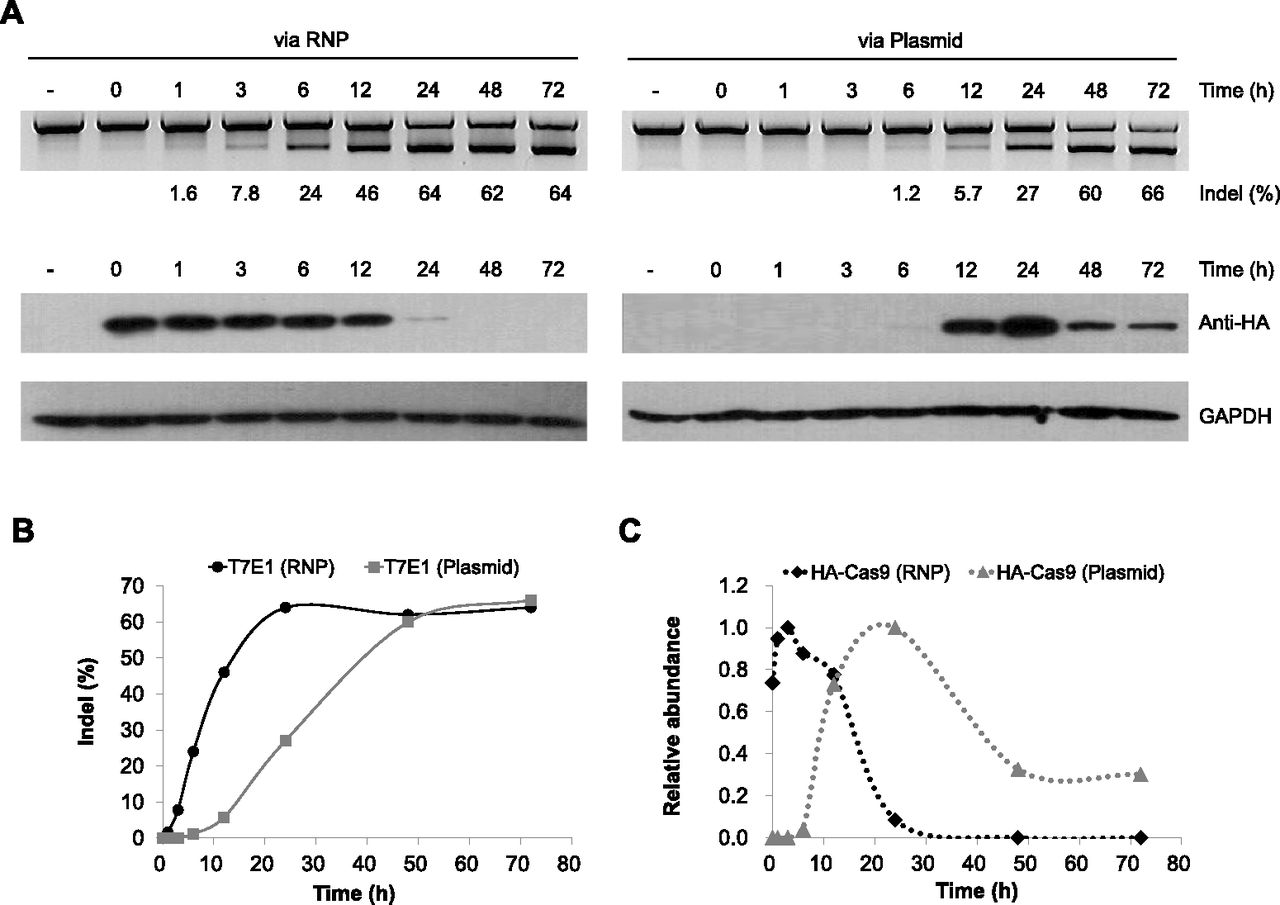
Figure 6.
Time-course analyses of RGEN-mediated genome editing via RNP delivery or plasmid transfection. (A, top) Mutation frequencies were determined by the T7E1 assay. (Bottom) Western blot analysis of K562 cells transfected with the CCR5-specific RGEN via RNP or plasmid DNA delivery. (B,C) Line graphs showing the results of the T7E1 (B) and Western blot analysis (C). Note that only the relative abundance of Cas9 in each experiment is shown.


