
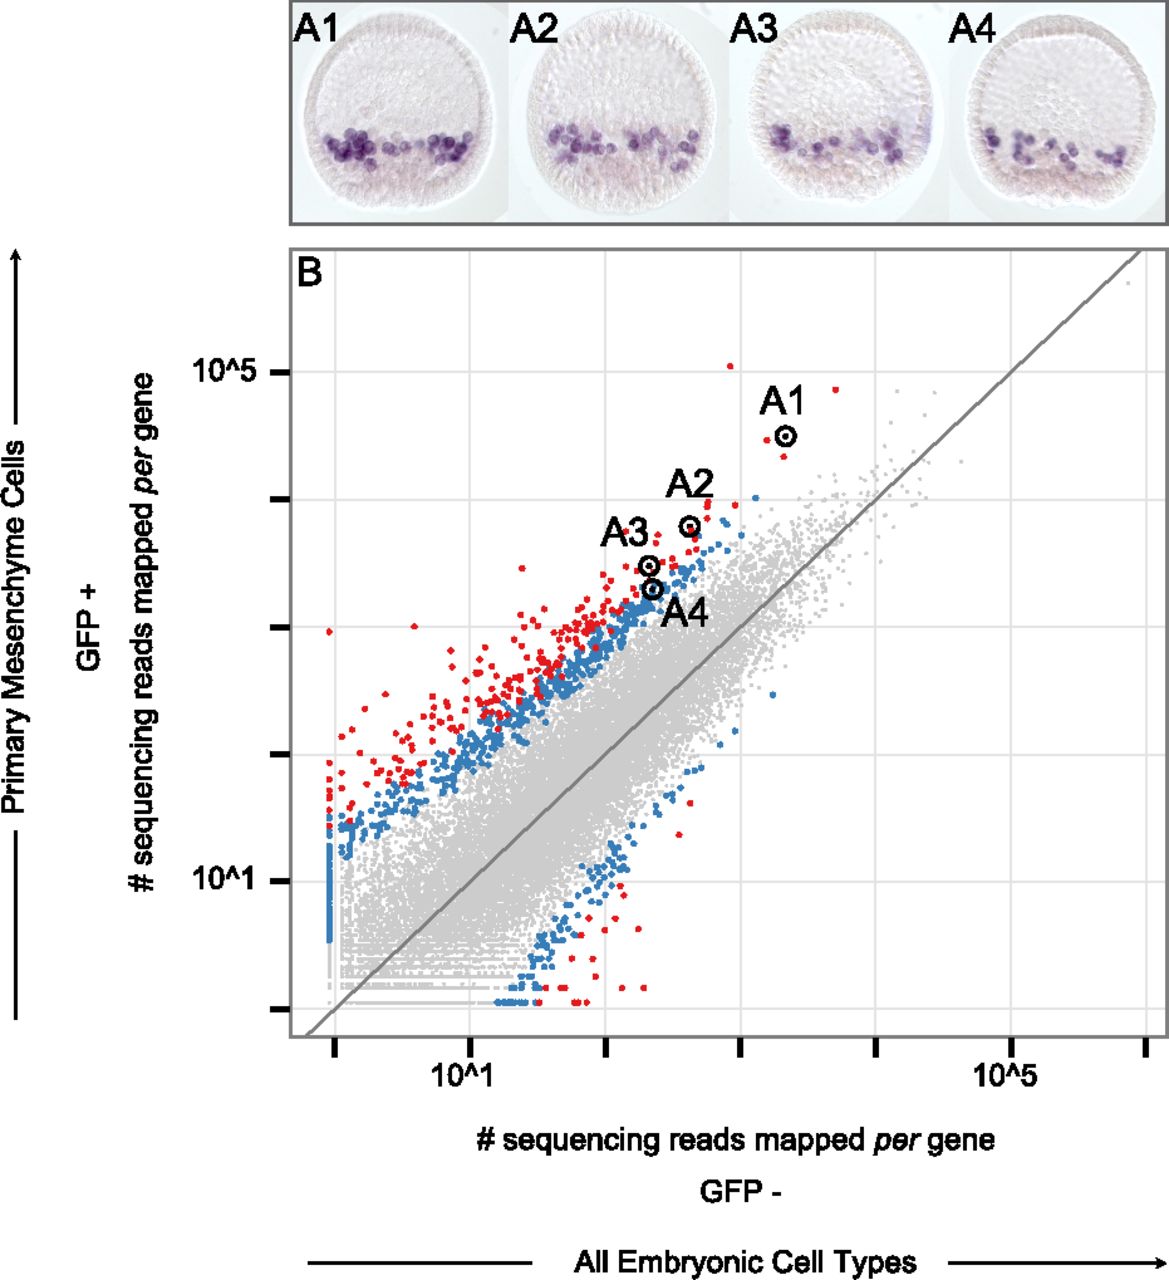
Figure 5.
Corroboration of cell type specificity. (A1–A4) Four of the genes tested for cell type-specific expression. Fixed Sp blastula with PMCs labeled in purple. Labeling was achieved by whole mount RNA in situ hybridization of cah10l (A1), msp130r1 (A2), p16 (A3), and 3apcol (A4). (B) Scatterplot identical to those described in Figure 4. Data points corresponding to the genes shown in A1–A4 have been encircled in order to distinguish them from other differentially expressed genes and labeled accordingly. Supplemental Table 1 lists all genes corroborated in a similar manner and the supporting data are shown in Supplemental Figures 4–12.


