
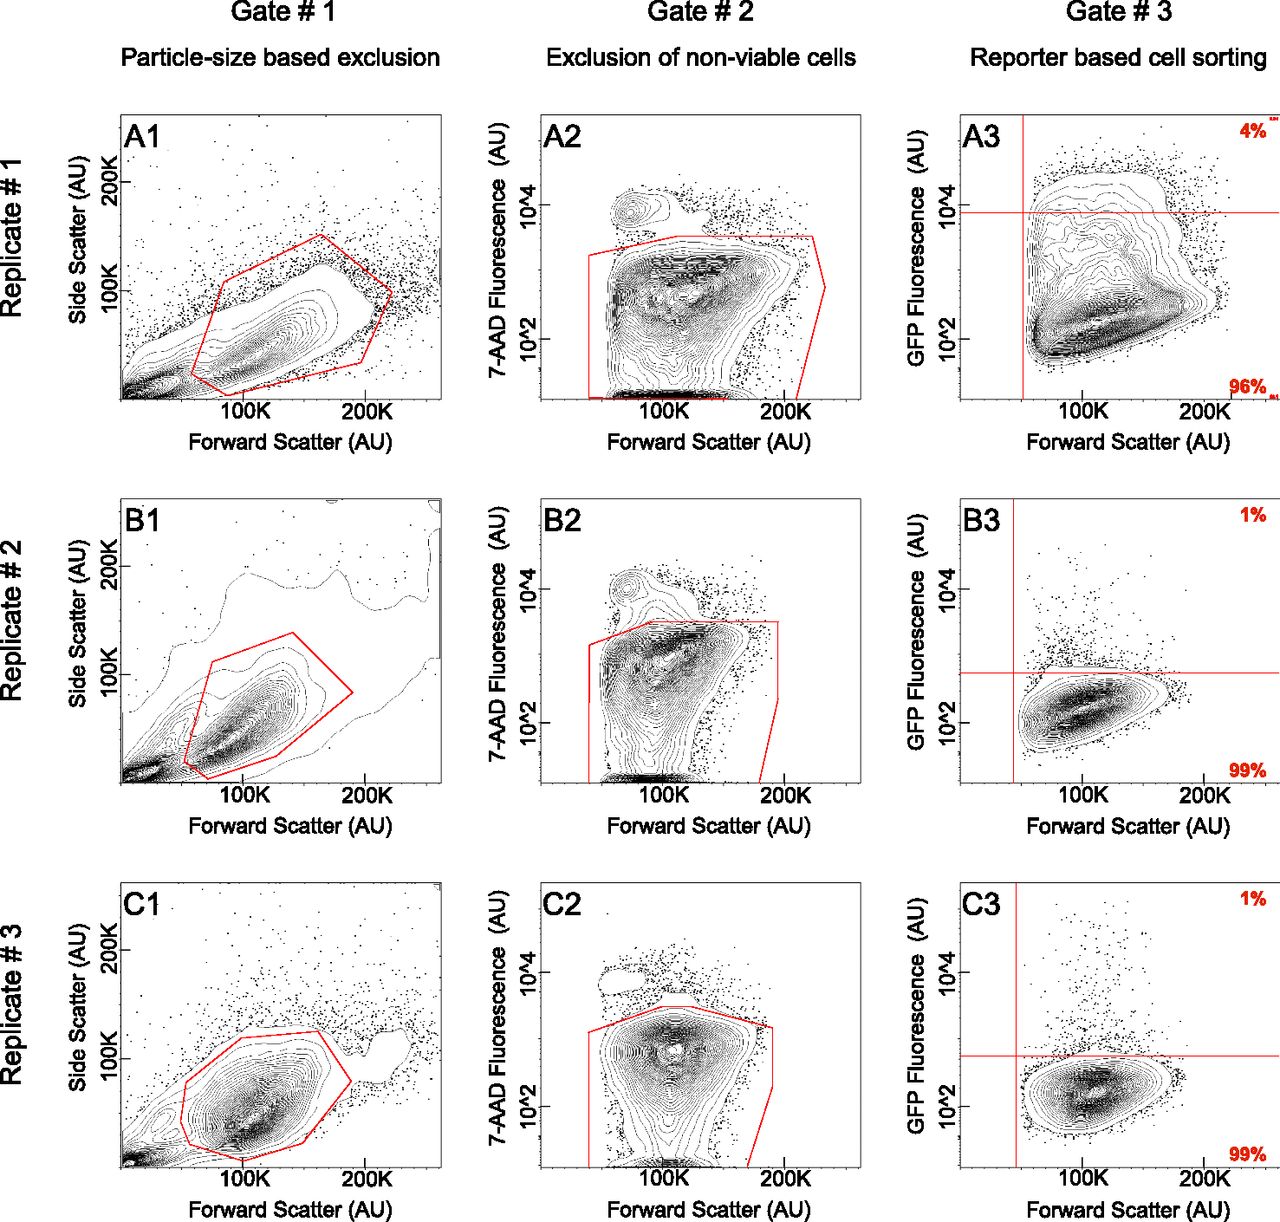
Flow cytometry gating strategy across replicates. (A1–C3) Flow cytometry data in the form of 2% probability contour plots. In all instances, events falling outside the lowest contour have been depicted as dots within the graph. (A,B,C) Each series reflects data from one of the three replicates. (A) Replicate #1 obtained by using an alx1:GFP BAC. Replicate #2 (B) and Replicate #3 (C) obtained by using a tbr:GFP BAC. (A1,B1,C1) Each graph depicts all the events detected by flow cytometry. Events enclosed within the polygonal red line were visually corroborated to constitute individual cells, hence promoted to a second round of analysis. (A2,B2,C2) Each graph reflects the fraction of cells that have incorporated 7-AAD. Consequently, these were excluded from further study. A polygonal red line encloses the cell population promoted to a third and final round of analysis. (A3,B3,C3) Each graph reflects the fraction of viable cells segregated by GFP FACS. Data points shown above the horizontal red line represent PMCs, whereas those below represent a heterogeneous population containing all cell types. Percentage displayed in red at the corner of each quadrant. A vertical red line demarcates the value beneath which an event likely reflects a technical artifact. (AU) Arbitrary units.


