
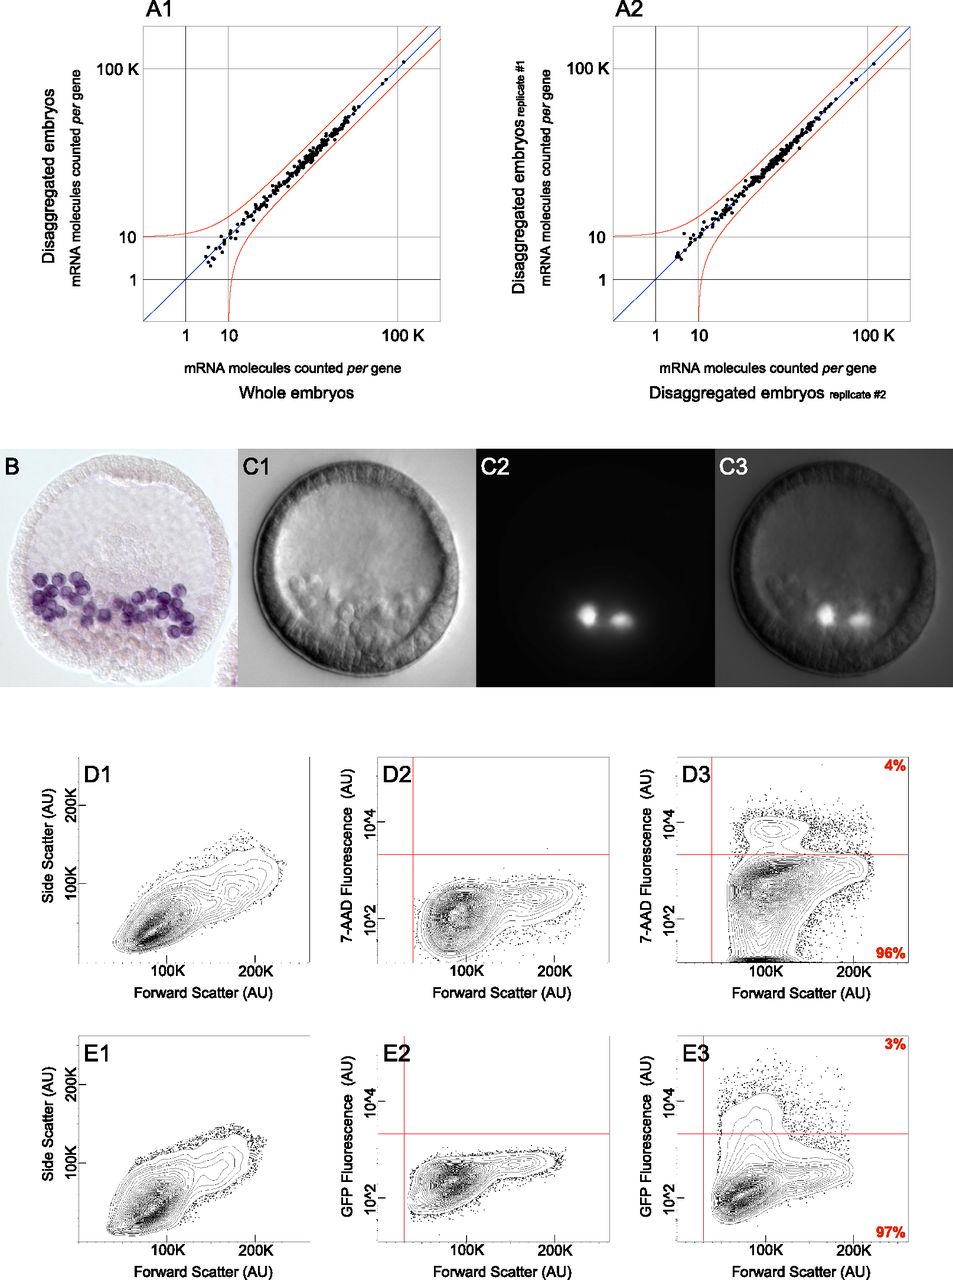
Assemblage of control experiments. (A) nCounter analysis system measurements quantifying the expression level of 181 regulatory mRNAs used to assess the gene expression profile of disaggregated embryos. Red line represents a twofold change in gene expression from moderate abundance onward. (A1) Cells from disaggregated embryos collected by flow cytometry show no change in gene expression when compared to undisturbed whole embryos. (A2) Cells from disaggregated embryos collected by flow cytometry show no change in gene expression among biological replicates. (B) Fixed Sp blastula with PMCs labeled in purple. Labeling was achieved by whole mount RNA in situ hybridization of cah10l mRNA. (C) Live transgenic Sp blastula carrying an artificial chromosome that contains GFP under control of the cis-regulatory apparatus governing tbr expression. (C1) DIC image of transgenic blastula. (C2) Epifluorescent image of the same specimen shown in C1 reveals that GFP is exclusively expressed in PMCs. (C3) Composite image generated by merging C1 with C2. (D,E) Flow cytometry data in the form of 2% probability contour plots. Events falling outside of the lowest contour have been depicted as dots within the graph. A vertical red line demarcates the value beneath which an event likely reflects a technical artifact. (D) The exclusion of nonviable cells required that threshold parameters be calibrated for 7-AAD fluorescence. (D1) Data reflects the variation in size among the cells utilized for 7-AAD calibration. (D2) Untreated cells were used in determining baseline fluorescence, depicted as a horizontal red line. (D3) Following 7-AAD treatment, cells observed to fluoresce above baseline were excluded from further analysis. (E) Segregation of cell populations by FACS required that threshold parameters be calibrated for GFP fluorescence. (E1) Data reflects the variation in size among the cells utilized for GFP calibration. (E2) Cells from uninjected embryos were used in determining baseline fluorescence, depicted as a horizontal red line. (E3) Cells from transgenic embryos were then segregated by FACS, according to their fluorescence relative to baseline. (AU) Arbitrary units.


