
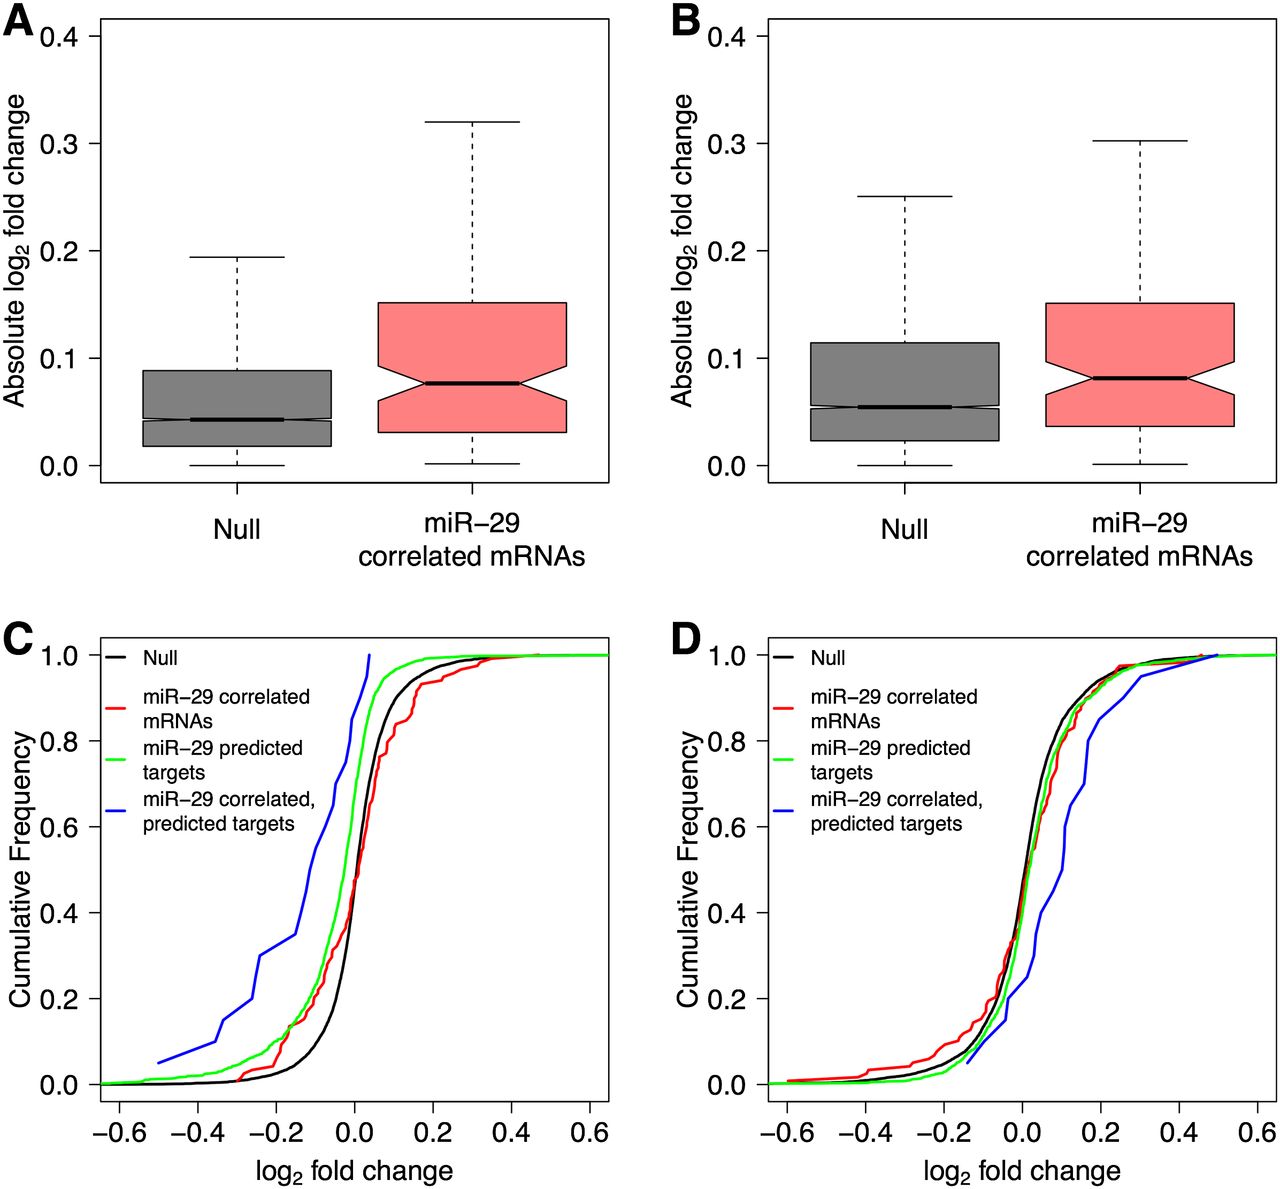
Figure 4.
Functional validation of miRNA–mRNA relationships using miR-29a gain- and loss-of-function experiments. (A,B) Boxplots showing absolute fold changes in genome-wide mRNA levels of cells transfected with either an miR-29a mimic (A) or an miR-29 inhibitor (B) and subsequently infected with MTB. (C,D) Cumulative distributions of changes in genome-wide mRNA levels after transfection with the mimic (C) or the inhibitor (D) in MTB-infected cells.


