
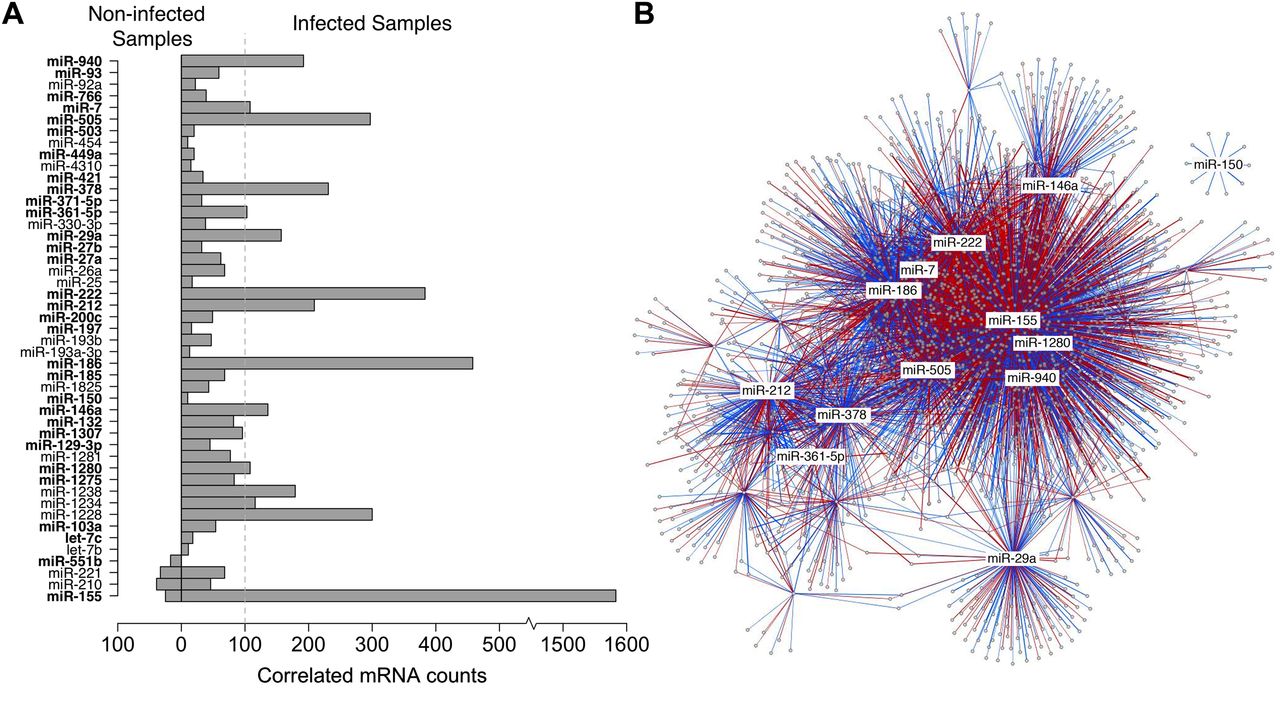
Relationship between the levels of expression of miRNAs and protein-coding genes. (A) Barplot showing the number of significantly correlated mRNAs per miRNA in non-infected and infected samples. Only miRNAs whose expression levels were significantly correlated with those of at least 10 mRNAs are shown. A total of 47 miRNAs were correlated with at least 10 mRNAs in non-infected and/or infected conditions, with three miRNAs satisfying this criterion in both conditions. A total of 31 of these 47 miRNAs were significantly differentially expressed upon MTB infection (marked in bold). (B) Regulatory network of significantly correlated mRNAs and differentially expressed miRNAs in MTB-infected samples. Nodes represent miRNAs and mRNAs. MiRNAs are labeled when correlated with more than 100 mRNAs, with the exception of miR-150, which is independent of the main network. Edge thickness reflects the strength of the correlation between one miRNA and one mRNA transcript. Edge color represents the direction of the correlation (red, negative; blue, positive).


