
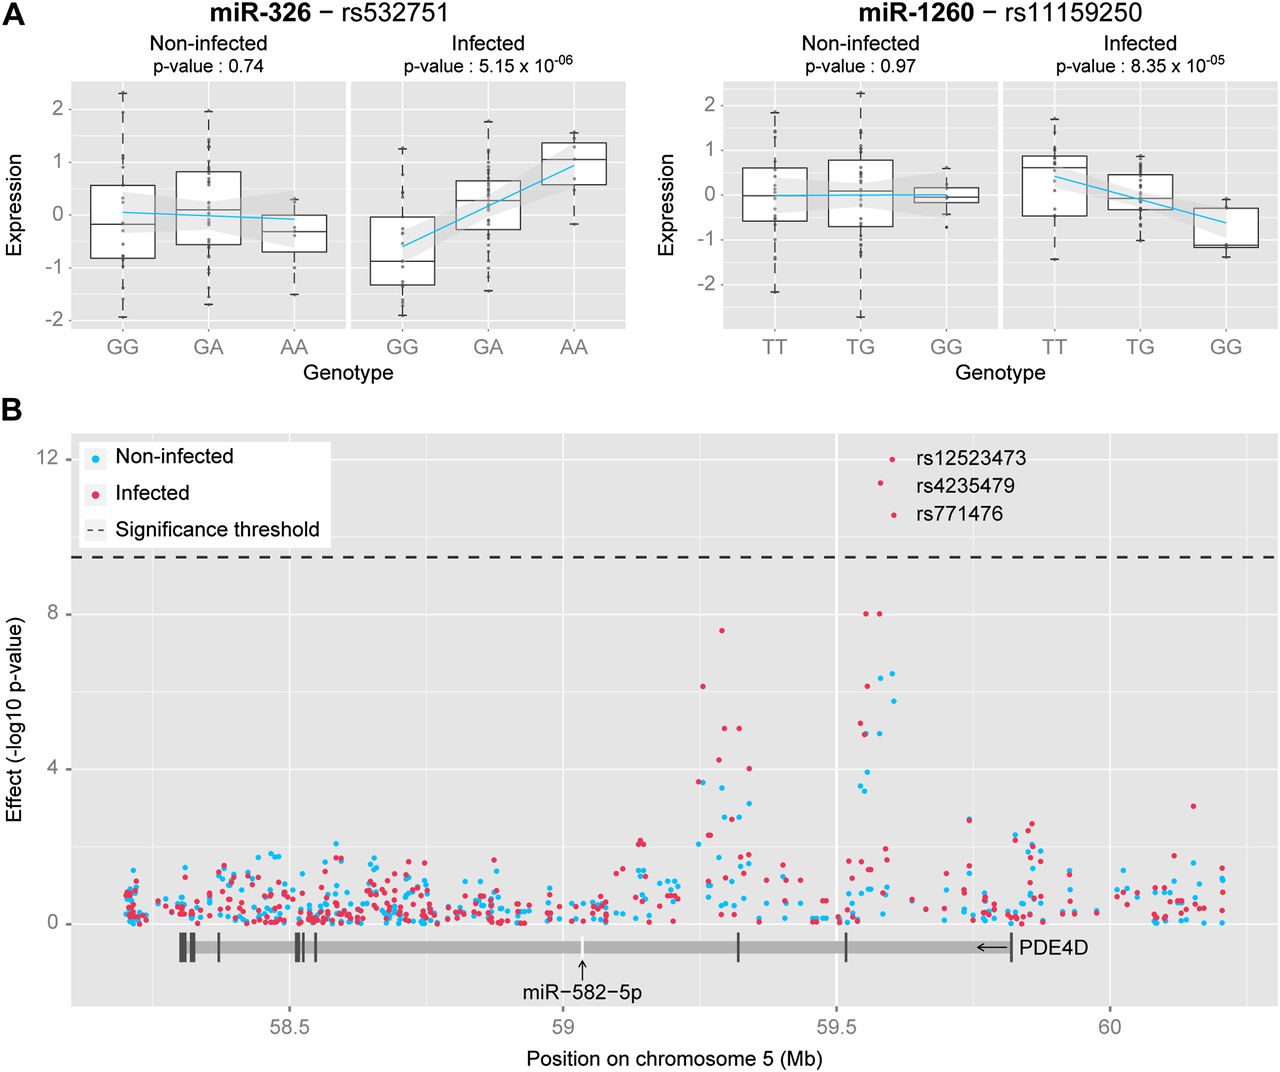
Figure 2.
MiR-eQTLs upon infection. (A) Boxplots showing the detected response miR-eQTLs in cis for miR-326 and miR-1260, in non-infected and infected samples. (B) Regional association plot for miR-582-5p and genotyped SNPs in the region of the gene PDE4D showing the location of a cluster of significantly associated SNPs ∼500 kb upstream of the miRNA in infected samples. An additional region, in between the detected eQTL and the miRNA, also showed a strong tendency of association; however, this did not reach genome-wide significance. All annotations are based on UCSC hg19.


