
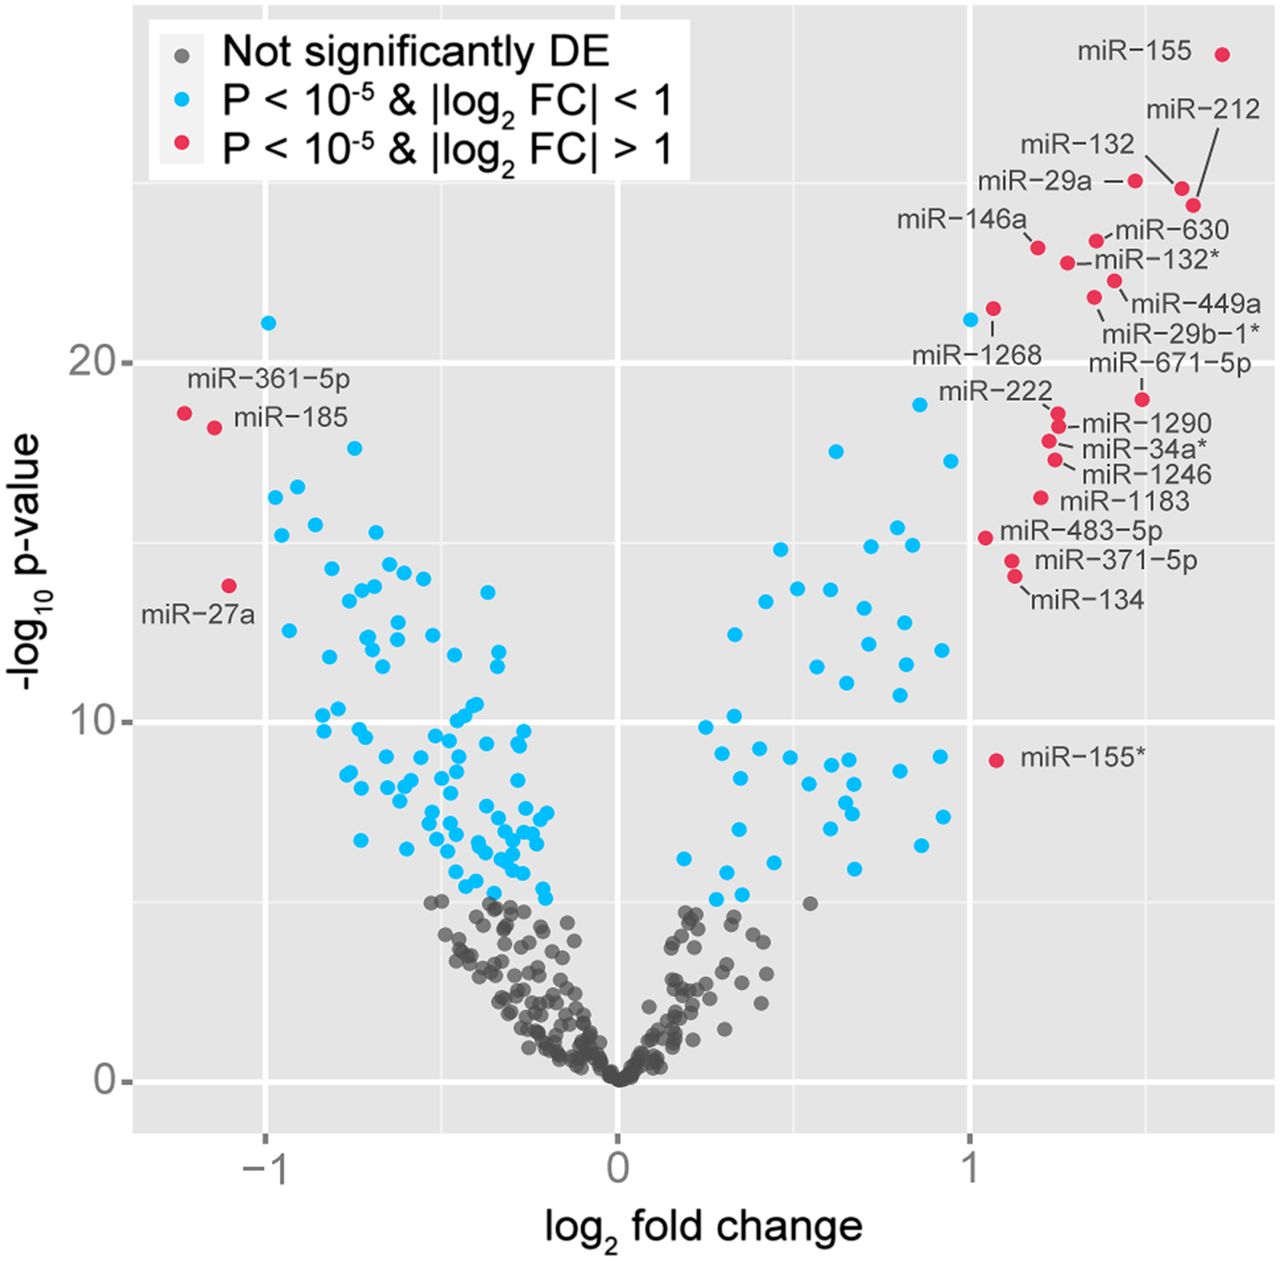
Figure 1.
Changes in miRNA expression levels upon infection. Volcano plot showing the differential expression of miRNAs in DCs upon infection with MTB. Red dots denote significantly differentially expressed miRNAs whose expression changed by more than twofold following infection, whereas blue dots represent significantly differentially expressed miRNAs whose fold change (FC) was less than two. (DE) Differentially expressed.


