
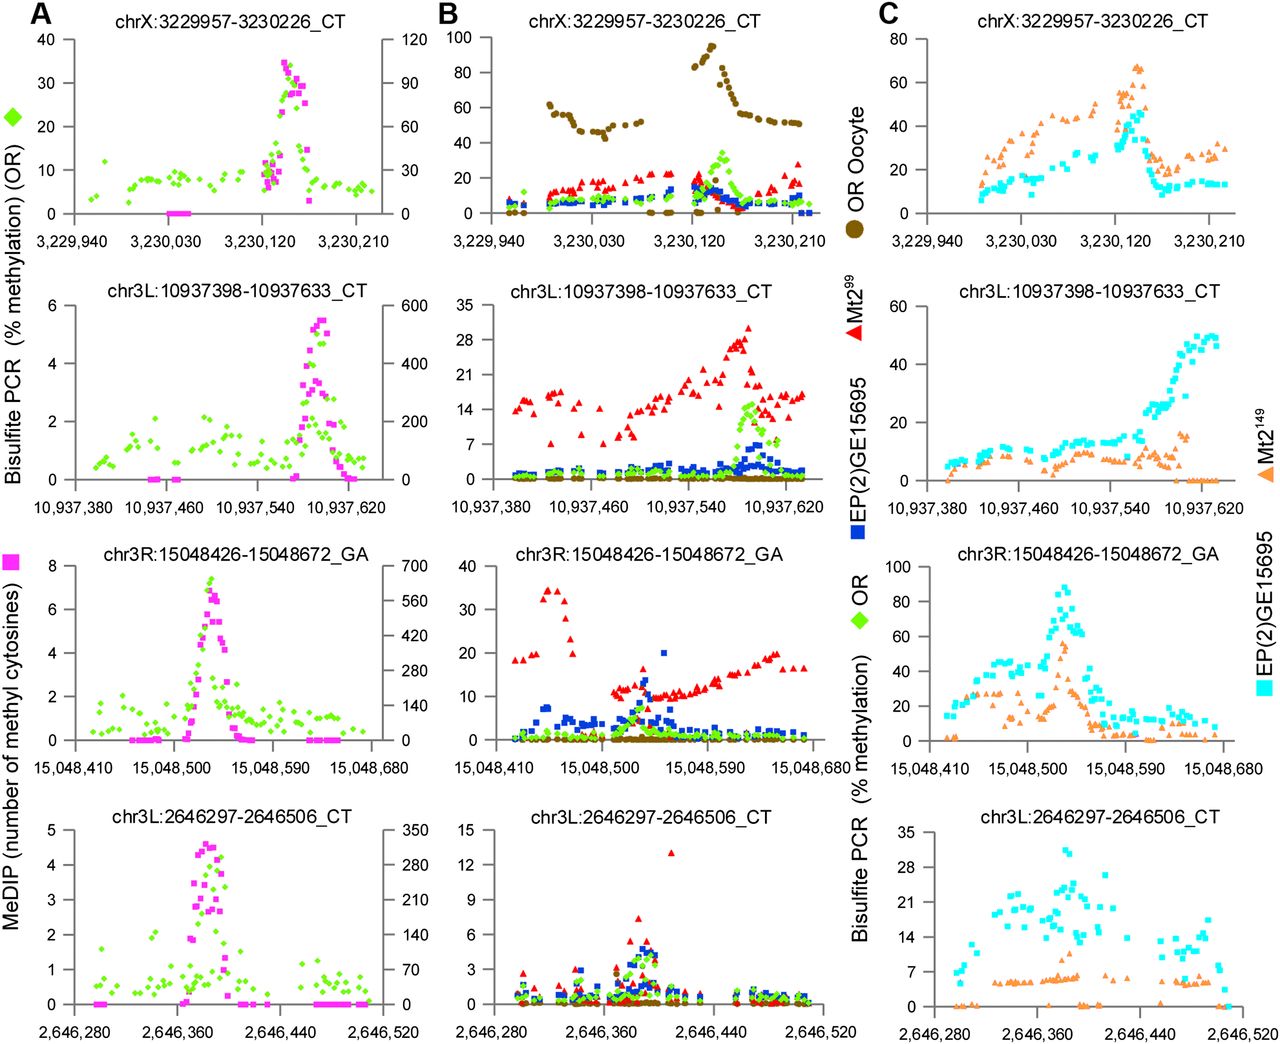
Direct amplification of bisulfite-converted DNA confirms methylation patterns and the presence of methylation in the absence of MT2. Four regions selected from the 66 that were analyzed (the full set is displayed in Supplemental Figs. S5, S8). Methylated regions identified by MeDIP-Bseq were PCR amplified from bisulfite converted DNA and Illumina sequenced to at least 10,000× coverage. Each dot represents one cytosine position. (A) bisulfite PCR (green); MeDIP-Bseq (purple). The y-axis at the left indicates the percentage of methylated cytosines in the bisulfite PCR; the y-axis at the right indicates the number of methylated cytosines detected by MeDIP-Bseq. Although the MeDIP-Bseq analysis is not quantitative, bisulfite PCR demonstrates the proportion of methylated cytosines at a given position, as well as the pattern of methylation of the amplified region. There is good agreement in the pattern of methylation detected by the two methods. (B) bisulfite PCR (green) (same data as A); unfertilized oocyte (brown); Mt2 deficient (Mt299) (red); EP(2)GE15695 (Mt2 wild type; strain provided by F. Lyko) (blue). The y-axis indicates the percenage of methylated cytosines in the bisulfite PCR. Methylation is also present in flies deficient for the DNA methyltransferase MT2 and at some loci in unfertilized oocytes. (C) Wild type EP(2)GE15695 (Mt2 wild type; stage 5 DNA provided by G. Reuter) (light blue); Mt2 deficient (Mt2149) (orange).


