
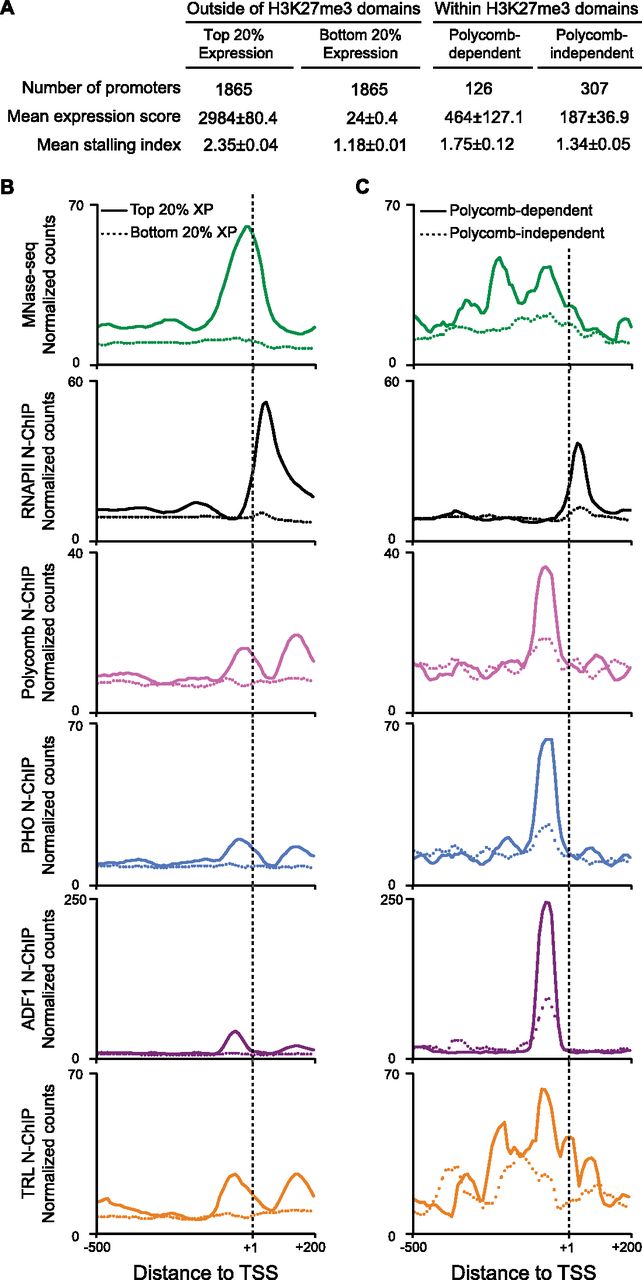
Polycomb-regulated promoters have extensive factor occupancy and stalled RNAPII. (A) Expression and stalling indexes of genes in S2 cells outside of H3K27me3 domains, genes within H3K27me3 domains and derepressed by Polycomb knockdown (Lagarou et al. 2008), and genes within domains but unaffected by Polycomb knockdown. (B,C) Aggregation plots showing factor distributions around promoters in S2 cells. Normalized read counts for MNase-seq fragments (<76 bp, green) and fragments recovered in N-ChIP experiments for the large subunit of RNAPII (Teves and Henikoff 2011), Polycomb, ADF1, TRL, and PHO are shown. (B) Factor distributions at promoters outside of H3K27me3 domains. Promoters in the top quintile of expression (solid lines) are compared with promoters in the bottom quintile (dashed lines) genes. Highly expressed genes display high occupancy in MNase-seq localized around the TSS, and a peak of RNAPII centered ∼50 bp downstream from the TSS. (C) Factor distributions at promoters within H3K27me3 domains. Promoters that are derepressed after RNAi knockdown of Polycomb (solid lines) are compared with promoters where expression is unchanged after Polycomb knockdown (dashed lines).


