
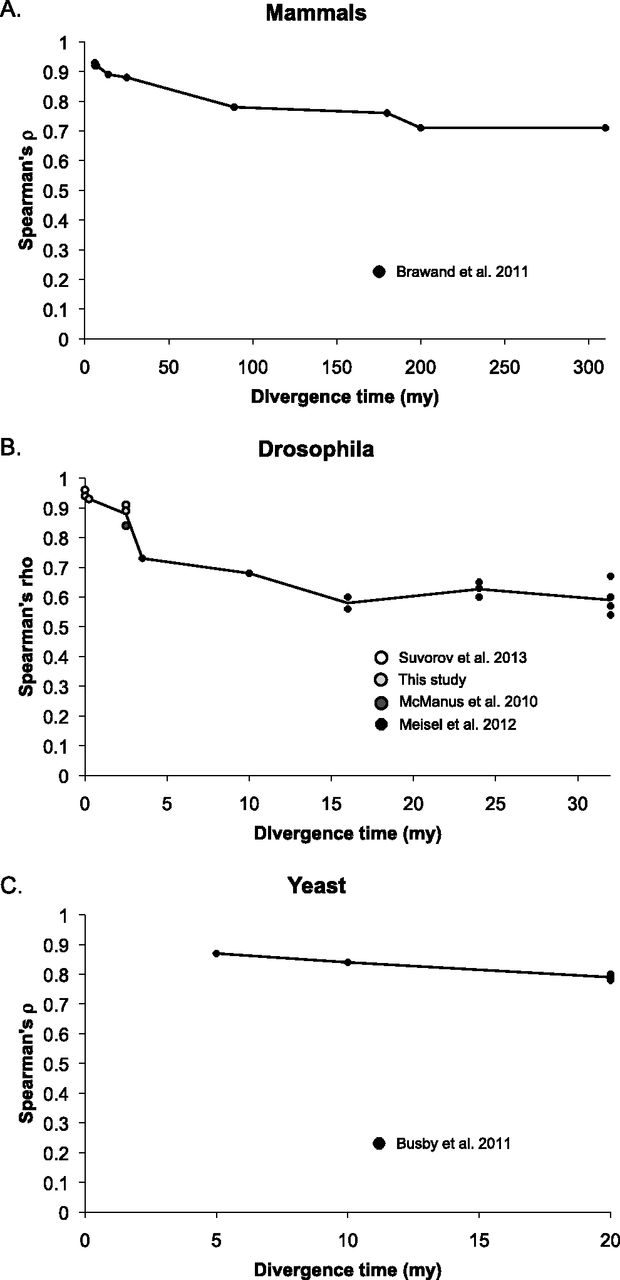
Expression divergence in mammals, Drosophila, and yeast. (A) Expression similarity (Spearman’s ρ) was calculated using RNA-seq data from kidneys published in Brawand et al. (2011) comparing human samples with those of eight other mammalian species and one bird. We chose to analyze the data from kidneys because they were the most representative of all the tissues examined (excluding testes). Divergence times in millions of years are as reported in Brawand et al. (2011). (B) Expression similarity (Spearman’s ρ) was calculated for data described in this paper (light gray circles) as well as data published in Suvorov et al. (2013) (open circles), McManus et al. (2010) (gray circles), and Meisel et al. (2012) (black circles). Divergence times for mel-mel, sim-sech, and mel-sim are as described in Figure 1A. For all other comparisons, estimated divergence times from Obbard et al. (2012) were used. (C) Expression similarity (Spearman’s ρ) was calculated using the data reported in Busby et al. (2011) for all pairwise comparisons of four yeast species. Divergence times for these species are from Kellis et al. (2003). In all three cases, the black line connects the average value of ρ for each divergence time sampled.


