
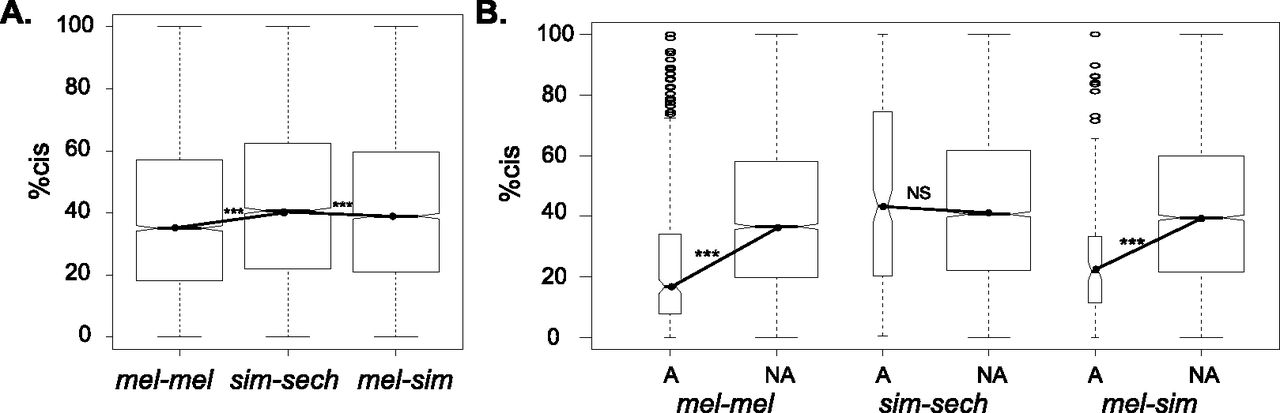
Effects of cis-regulatory divergence. (A) The percentage of total regulatory divergence attributable to cis-regulatory divergence (% cis) is shown for the mel-mel, sim-sech, and mel-sim comparisons. (B) % cis is compared for sets of genes showing additive (“A”) and nonadditive (“NA” [dominant or misexpression]) inheritance for each comparison. In all panels, notched box plots show the full range of values as well as the 25th, 50th, and 75th percentiles. Within both panels, the widths of the boxes are proportional to the number of genes represented. Statistical significance of differences between median values connected with solid lines was determined using Mann-Whitney U-tests. (*) P ≤ 0.05, (**) P ≤ 0.001, (***) P ≤ 1 × 10⁻⁴. Comparable analyses for reciprocal hybrids are shown in Supplemental Figure S17.


