
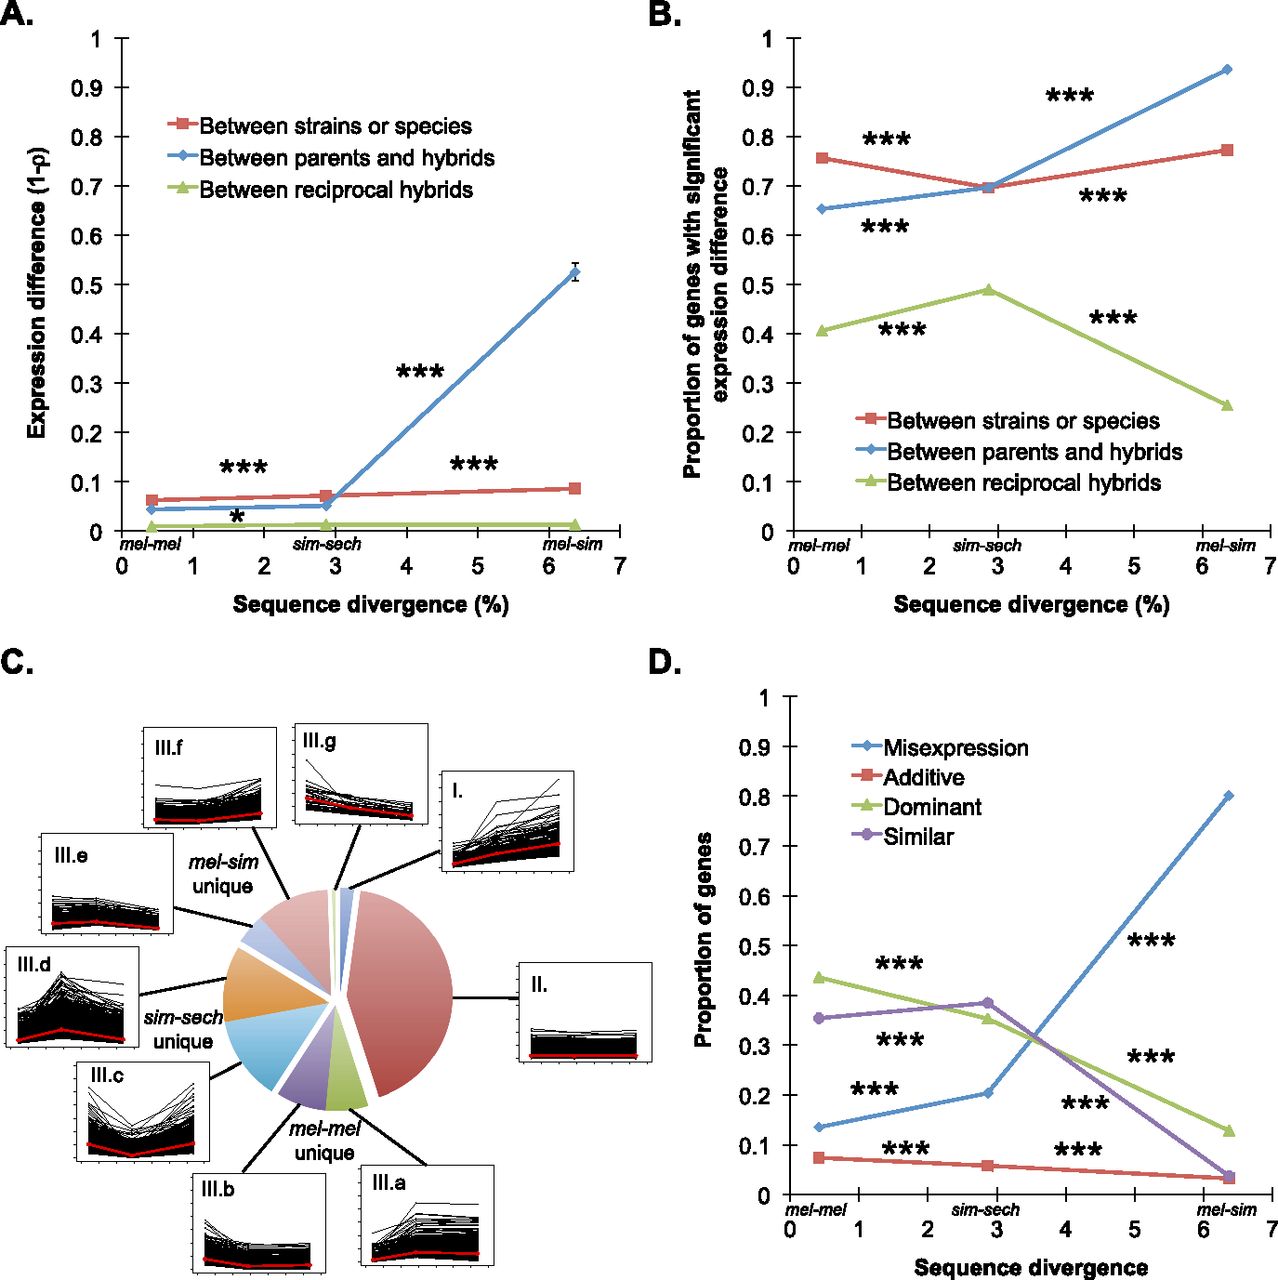
Expression divergence between genotypes and in F1 hybrids. (A) Overall expression divergence (1 − ρ) is shown for the mel-mel, sim-sech, and mel-sim comparisons in red, with the data used for these calculations shown in Supplemental Figure S5. Average differences in expression between F1 hybrids and each of the parental species are shown in blue, with the data used for these calculations shown in Supplemental Figure S7. Expression divergence between reciprocal F1 hybrids is included as a baseline in green, with the data used for these calculations shown in Supplemental Figure S3. In this and all other figures, results from each comparison are plotted using the genomic sequence divergence observed between the genotypes involved (Fig. 1C). (B) The proportion of genes showing evidence of significant expression differences between genotypes (red), the average proportion of genes showing significant expression differences between F1 hybrids and each parental species (blue), and the proportion of genes with significant expression differences between reciprocal F1 hybrid genotypes (green) are shown. (C) The line plots show expression differences for individual genes in the mel-mel, sim-sech, and mel-sim comparisons plotted according to divergence time, with the 7587 genes included in Data set 1 classified into nine groups depending on whether they showed increased, decreased, or similar expression differences between mel-mel and sim-sech and between sim-sech and mel-sim. The red line in each plot shows the median expression difference for genes in that class for each comparison. The pie chart shows the relative frequency of genes in each class. (D) The proportion of genes showing expression levels in F1 hybrids consistent with additive inheritance (red), dominant inheritance (green), misexpression (blue), or similar expression (purple) is shown for each comparison. Data used to calculate these proportions are shown in Supplemental Figure S8. Error bars in panel A show the 95% quantiles from 10,000 bootstrap replicates in which differences in 1 − ρ between mel-mel and sim-sech as well as between sim-sech and mel-sim were calculated for each bootstrap replicate. The significance of the observed deviation from zero was determined by comparing the observed value to the distribution of bootstrap values. In panels B and D, significance was determined using Fisher’s exact tests. Significance of each comparison: (*) P ≤ 0.05, (**) P ≤ 0.001, (***) P ≤ 1 × 10⁻⁴.


