
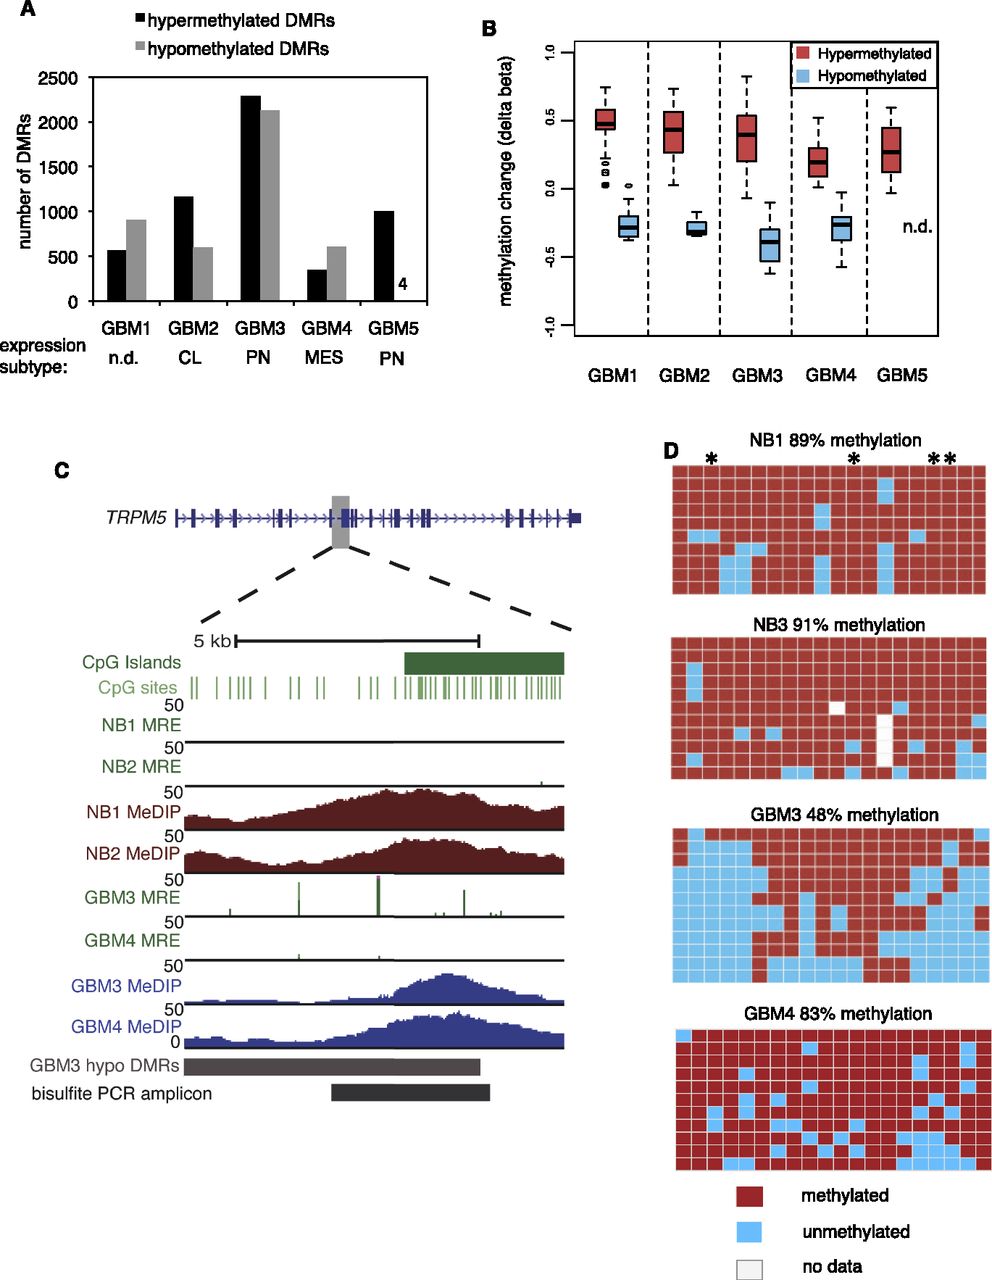
Discovery and validation of DMRs in GBM. (A) Number of hypermethylated and hypomethylated DMRs at Q < 10−13 in five primary GBMs. The expression subtype (Verhaak et al. 2010) of each tumor is shown below. (n.d.) Not determined. (CL) Classical. (PN) Proneural. (MES) Mesenchymal. (B) Delta beta values (GBM-normal brain) from Infinium HumanMethylation27 arrays, plotted for individual CpGs within hyper- and hypomethylated DMRs (Q < 10−13) for each of five GBMs. For GBM 5, there were no Infinium CpGs within hypomethylated DMRs. (n.d.) No data. (C,D) Validation of gene body hypomethylation in TRPM5 by bisulfite cloning and sequencing. In C, the location of hypomethylation is shown within the TRPM5 gene body. Normalized MeDIP-seq coverage is graphed in brown for normal brain and blue for GBM. For MRE-seq, normalized read counts at single CpGs are in green. For GBM tracks, MeDIP-seq and MRE-seq values are normalized by copy number and sequencing depth. In D, bisulfite PCR, cloning, and sequencing results are shown for 20 CpGs in the region “bisulfite PCR amplicon” in C. Each row is a clone and each column is a CpG site. Asterisks indicate CpGs with MRE sites.


