
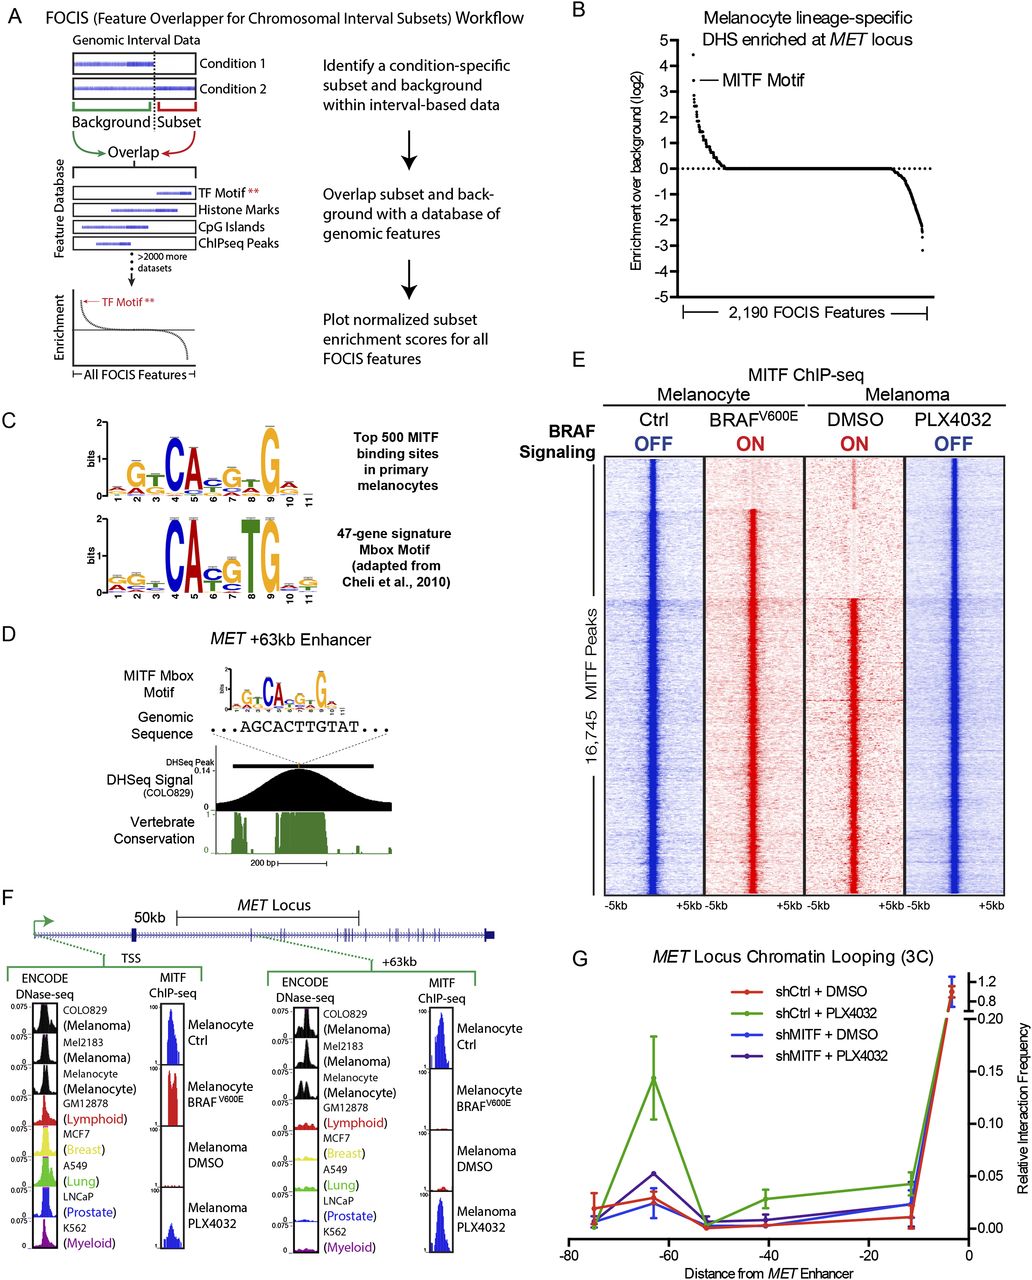
Integrative epigenomic analysis identifies MITF as a regulator of MET enhancer function. (A) Schematic workflow for the feature overlapper for the chromosomal interval subsets (FOCIS) algorithm. (B) FOCIS feature enrichment for melanocyte lineage-specific DHS at the MET locus. Enrichment for the transcription factor MITF is noted. (C) MITF “Mbox” motif derived from the top 500 MITF-binding sites in ChIP-seq data from primary melanocytes (top, the present study) and from the previously published 47-gene signature (bottom). (D) Characteristics of the lineage-specific enhancer 63 kb downstream from the MET TSS, including the MITF Mbox motif sequence, COLO829 DNase-seq signal, and phastCons vertebrate conservation. (E) Peak-centered heatmap of MITF ChIP-seq signal in primary melanocytes and melanoma cells in the context of inactive (blue) and active (red) BRAF signaling. (F) DNase-seq and MITF ChIP-seq signal at the MET gene TSS and the +63-kb melanocyte lineage-specific enhancer. Normalized ChIP-seq signal is shown on an arbitrary 1–100 scale; ENCODE DNase-seq data shown as F-seq density signal. (G) 3C at the MET locus as a function of BRAF inhibition and MITF depletion in COLO829 melanoma cells. Matched control 3C data from Figure 1E are also shown in this figure for reference.


