
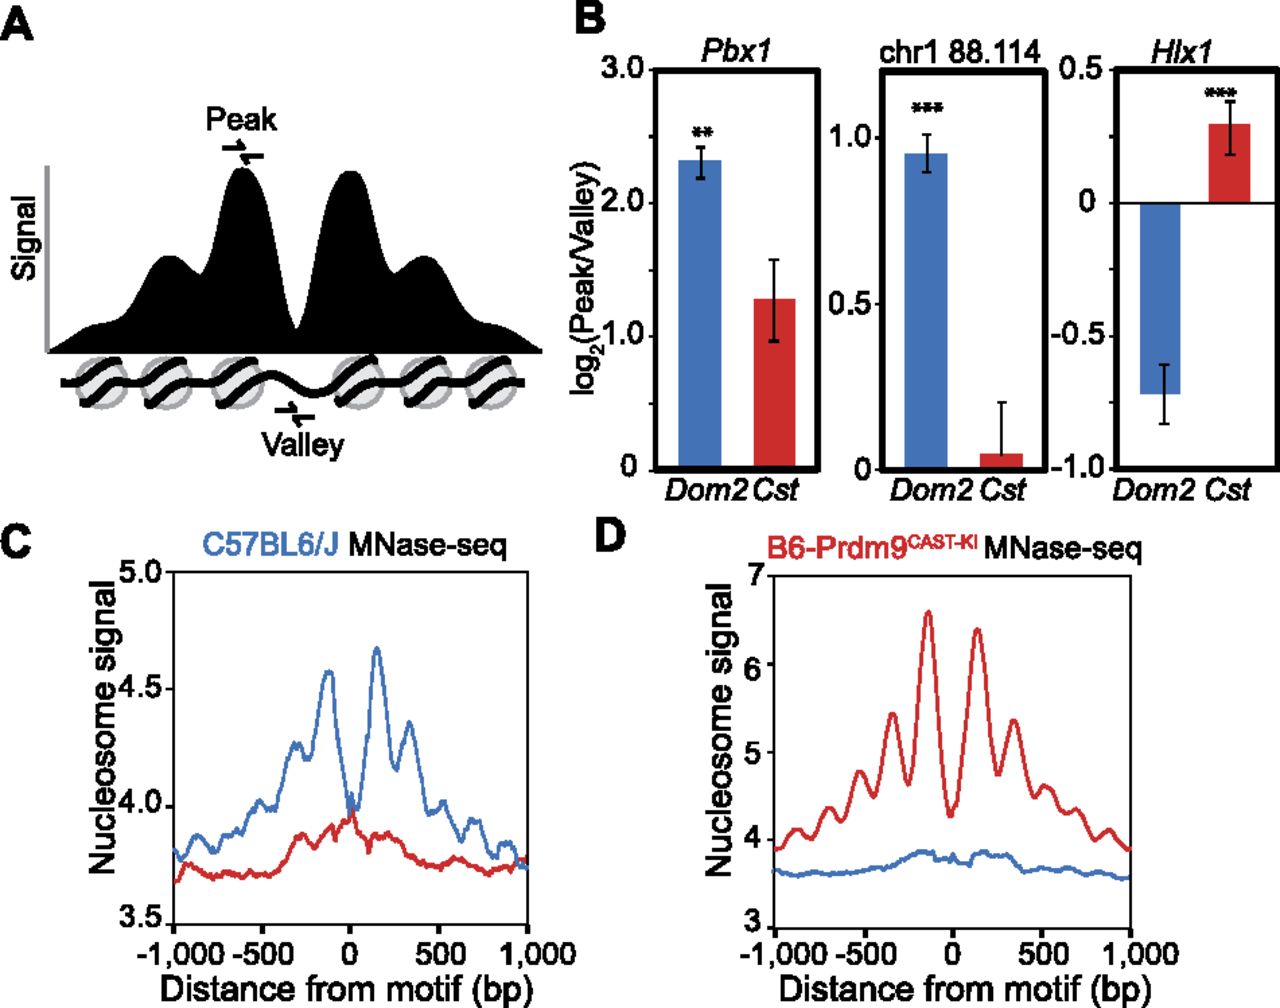
Nucleosome positions at hotspots are variable prior to PRDM9 binding. (A) Schematic of an idealized PRDM9-modified hotspot showing signal intensity representing nucleosome positions. Primers for qPCR were designed to amplify DNA from either the −1 or +1 nucleosomes flanking the NDR (peak) or from within the NDR (valley). (B) Ratio of nucleosome peak vs. nucleosome-depleted valley signal in two genetic backgrounds. qPCR was performed on MNase-digested spermatocyte chromatin DNA from both strains (blue: DNA from Prdm9Dom2; red: Prdm9Cst). Error bars represent standard deviation of triplicate measurements from three biological replicates. (**) P < 0.01, (***) P < 0.001; one-sided t-test. Hotspots Pbx1 and chr1 88.114 Mb are PRDM9Dom2-activated; hotspot Hlx1 is PRDM9Cst-activated. (C) Aggregation plot showing nucleosome positions at hotspots inferred from MNase-seq of C57BL/6J spermatocytes. Only hotspots containing a motif that is predicted to be recognized by the endogenous Prdm9 allele show organized nucleosomes (blue: aggregation of Prdm9Dom2 sites; red: Prdm9Cst sites). (D) Aggregation plot of Prdm9Dom2 and Prdm9Cst hotspots from sequencing of mononucleosome DNA prepared from B6-Prdm9CAST-KI spermatocytes.


